Bitcoin Analysis – we just reached our target

Today, we will deal with the two Bitcoins. First one will be the father, the original, one and only BTC. Last time mentioned by us on the 13th of April, when the price was very close to a breakout of the long-term down trendline. That was a crucial time for the mid-term situation on this instrument. Let’s look what was our view on that:
„Currently, we see almost 7900 USD on the screen but I guess that the buyers have appetite for much more. The current target is the black line on the 9200 USD.
On more thing. We are now having an attempt to break the long-term down trendline (pink). If that will finish with a bullish success, we may see a much stronger movement, aiming at least 11200 USD (green).”
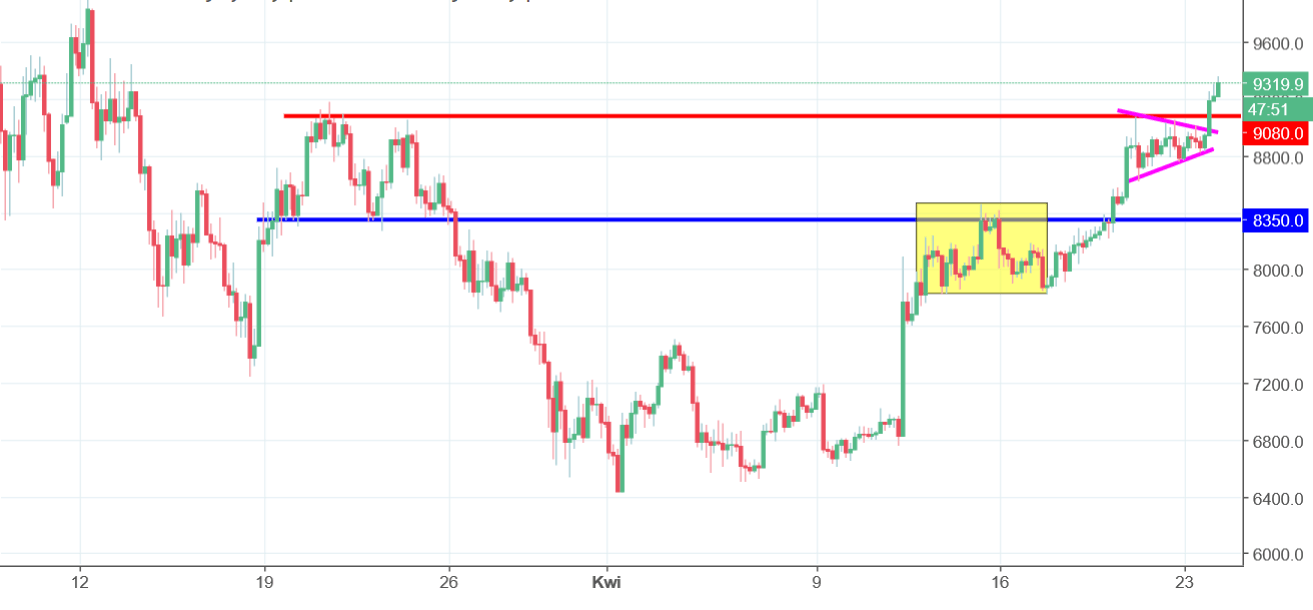
Our view was positive and we saw the first target on the 9200 USD. We reached this level today! What a good call from our ForexNewsNow team. The most recent optimism is technically supported by two factors. First one was the failed head and shoulders pattern (yellow rectangle) and the second one was the small pennant pattern that emerged recently (pink lines). The breakout of the upper line of the pennant helped the price to climb above the 9080 USD resistance (red). Current sentiment is positive and I see a big chance for a movement towards the absolutely crucial resistance for the BTC – 11200 USD!


Comments (0 comment(s))