Bitcoin Gold Analysis – Waiting for a breakout

Wednesday starts for us with the analysis of the Bitcoin Gold. Previously, we were talking about this instrument on the 23rd of July and we were bearish. I always try to be humble but I have to say that the previous analysis was great! The price did exactly what was expected. For the record, we anticipated the following scenario:
“Currently, BTG is in the flag formation (blue lines). Flag promotes a trend continuation, so a further drop. Additional bearish factor is that we are still below the green horizontal resistance. Sell signal is on as long as we stay below the upper blue line. „
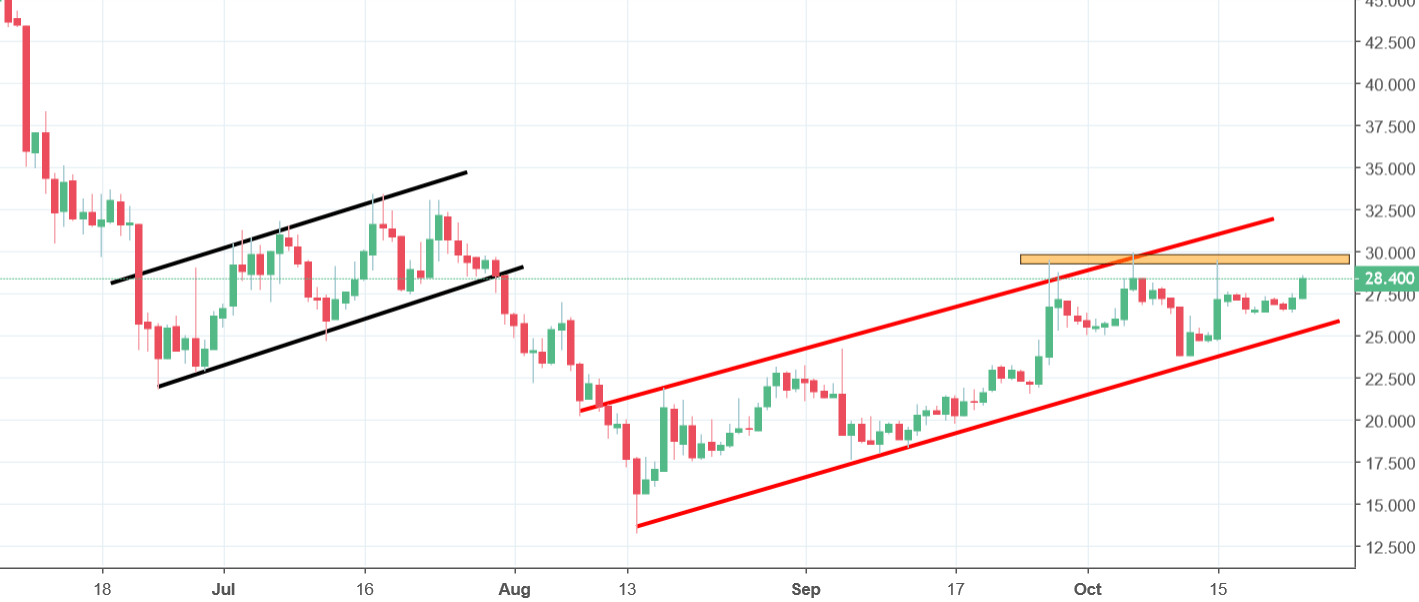
The price broke the lower line of the flag few days later. From the 30 USD seen in our last piece, we went straight to the 13 USD in the middle of August. Nice! Currently, the price is creating another, this time bigger, flag (red lines). That formation is promoting a further drop. Today we are up almost 5% but we do not have a buy signal yet. The way how you can trade this is but when the price will break the orange resistance and sell when the price will break the lower red line. As long as we are between those two, we need to be patient.


Comments (0 comment(s))