BitShares Analysis – As expected, we are going down

The path of our successful analysis continues. Today, we will talk about the BitShares and a good trading signal that we gave, not so long ago, on the 17th of May. Back in that day, the price was around the 0.25 USD and was inside of the rectangle with a big chances for a bearish breakout. In our last analysis about the BTS, we wrote:
„The outcome of that on this coin is the same as on the Lisk – we should see a further decline. In case of the BitShares, the potential target is on the 0.11 (black), which marks the yearly lows. Chances that we will get there are relatively high. „
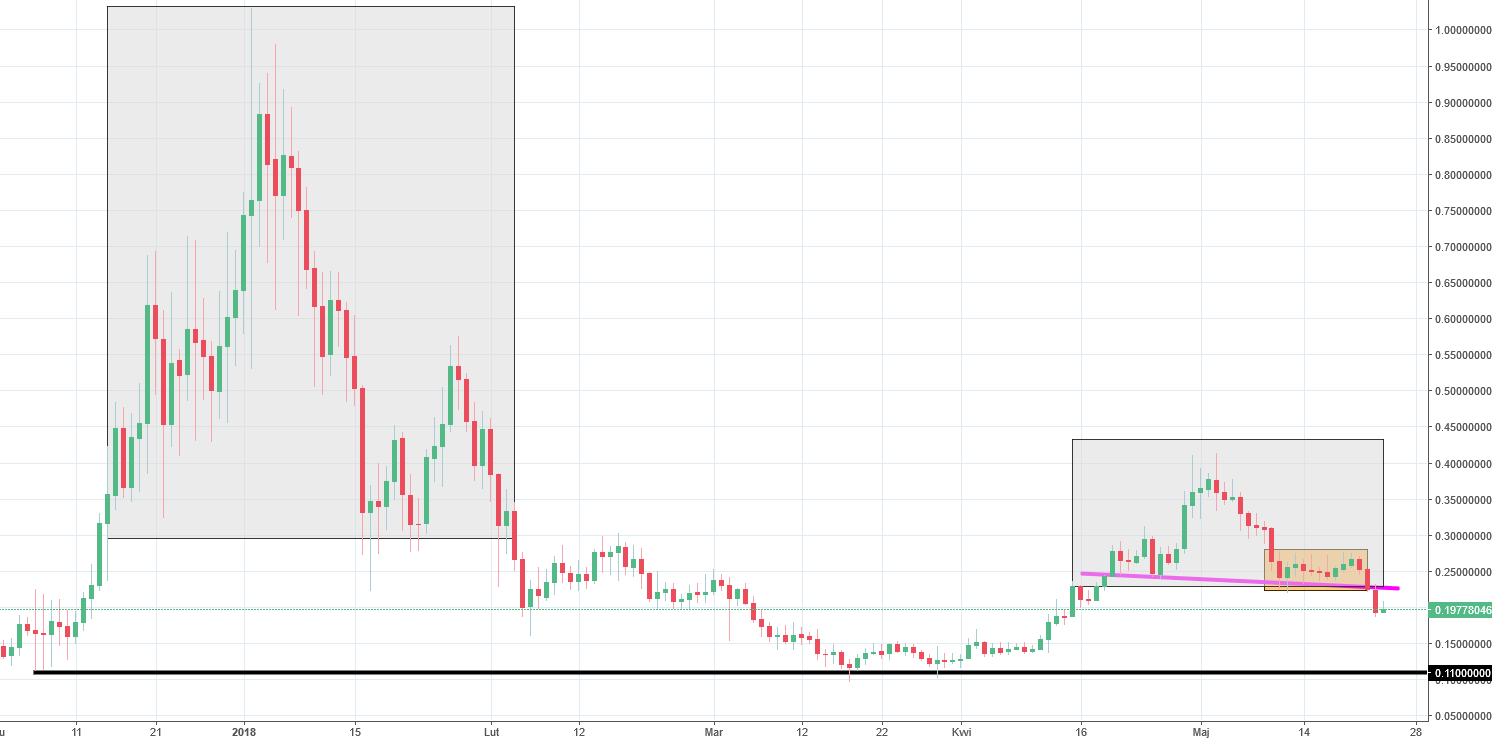
For the bearish breakout we had to wait a bit but it did happen yesterday. Rectangle was not the only formation that was present on the chart. In addition to that, we also had a head and shoulders formation (smaller grey rectangle), which was also very pessimistic. Breakout of the lower line of the rectangle was in the same time the breakout of the neckline (pink), so in theory, the sell signal is very strong.
This is not the only head and shoulders pattern here. We had one at the end of the 2017 and beginning of 2018 (bigger grey rectangle) so you see that this coin is respecting this kind of patterns. The target that we set in our last piece about the BitShares does not change – we should see the price around 0.11 USD relatively soon.


Comments (0 comment(s))