ChainLink Analysis – Bounce from the 0.25 USD

Wednesday starts with the analysis of the ChainLink. This will be the first time, when we analyse this coin but definitely not the last one as the movements here are very technical.
First of all, you can see the head and shoulders pattern (orange). This formation cancelled the upswing and started the current down trend. After breakout of the neckline, the price went significantly lower, creating in the meantime the pennant formation (red). Pennant is a trend continuation pattern so no surprise that the price went lower.
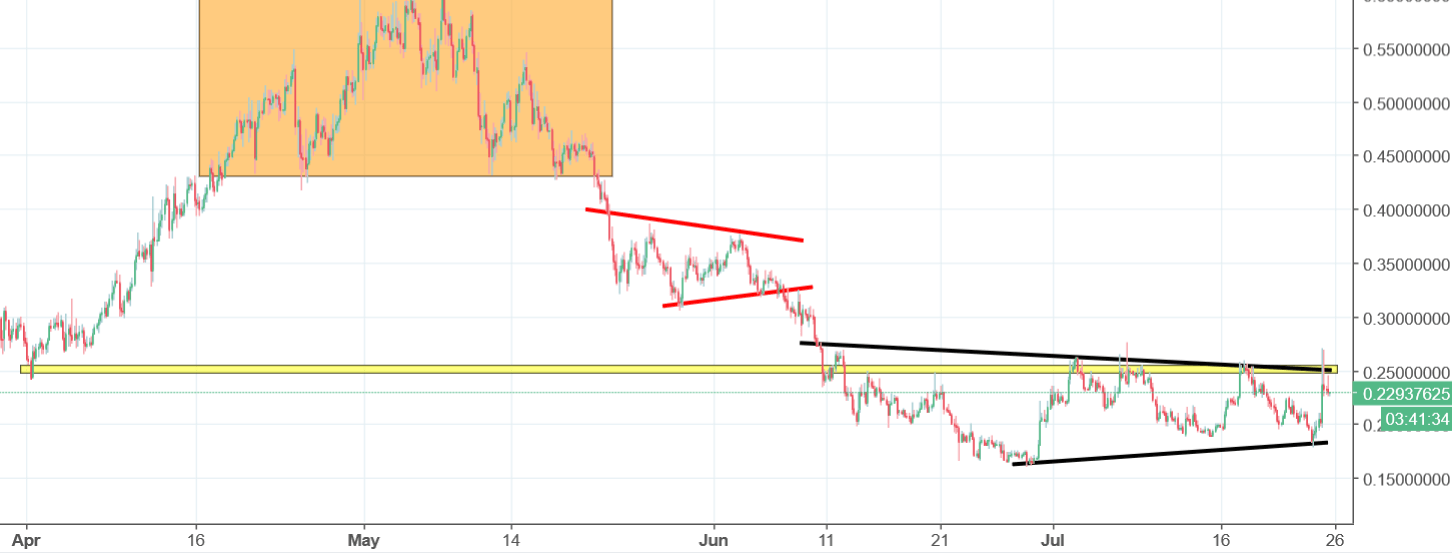
Currently, we are locked in the similar formation but in this case, this is a triangle pattern (black lines), as the formation is much bigger. The difference is that this pattern can result in a breakout of the lower and upper line so now it is not the best time to trade.
Breakout to the downside is more probable as the resistance on the 0.25 USD got rejected today, which is now shifting the situation towards the further drop.


Comments (0 comment(s))