Crypto Report – Oh boy, another lower lows. Bitcoin, Ethereum and NEM

Probably on many cryptos, pain by now starts to be unbearable. That can be actually another bearish factor: those who bought on the top, are now selling to get rid of the pain and their sell orders are fuelling a further drop. Hard to find a way out of it. Today we will analyse Bitcoin, Ethereum and NEM. Yesterday’s session was brutal for the crypto bulls. Many altcoins lost another 10% of the value. Today is a bit better but is seems that this is just a dead cat bounce.
Bitcoin with the 6 on front
Yes, today the BTC was quoted around 6600 USD. That was the lowest point of the day. The target for the current wave is the 6000 USD (blue), which was an important level in October, November and February. By the way, was the current drop expected? Yes, in our analysis from Monday we wrote:
“The resistance on the 9200 USD (black) was respected as in a textbook and we should definitely remember this value for the future. The aim stays the same (6000 USD) but first, the price needs to break the lows from the 17th of March, which can be quite challenging. „
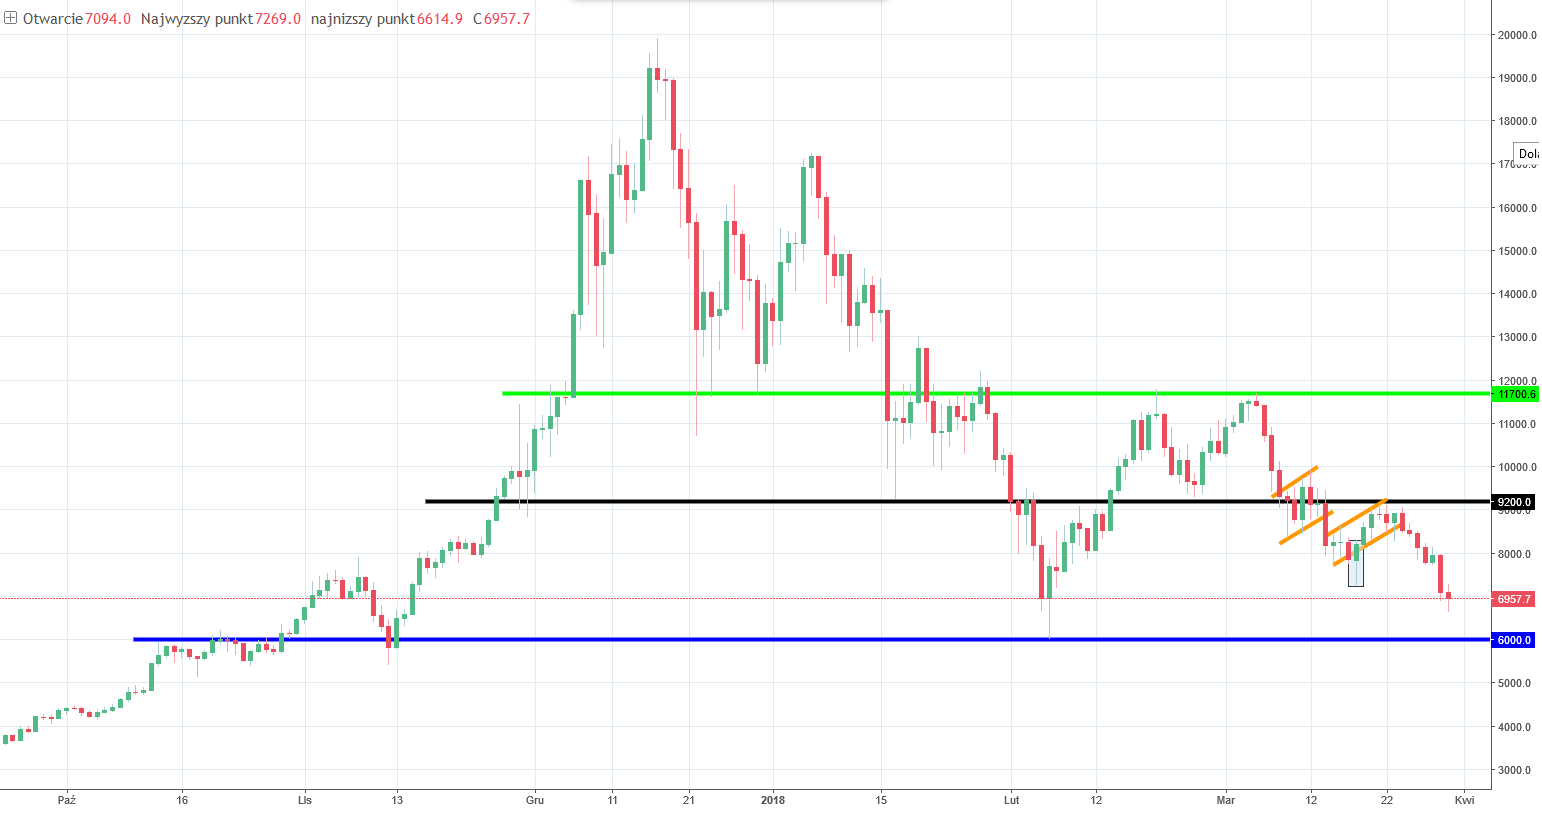
To wrap that up, Bitcoin is still in a negative territory. Current hammer has rather a small potential to stop that drop and I think that the blue line should be eventually reached.
Ethereum reaches the target
Eagle has landed. ETH reached a 390 USD support (black), which was mentioned by us multiple times. Most recently on Tuesday, when we wrote:
“Now we are below the support on the 500 USD and we are trading around the 450 USD. Our view stays the same, the test of the 390 USD seems imminent. „
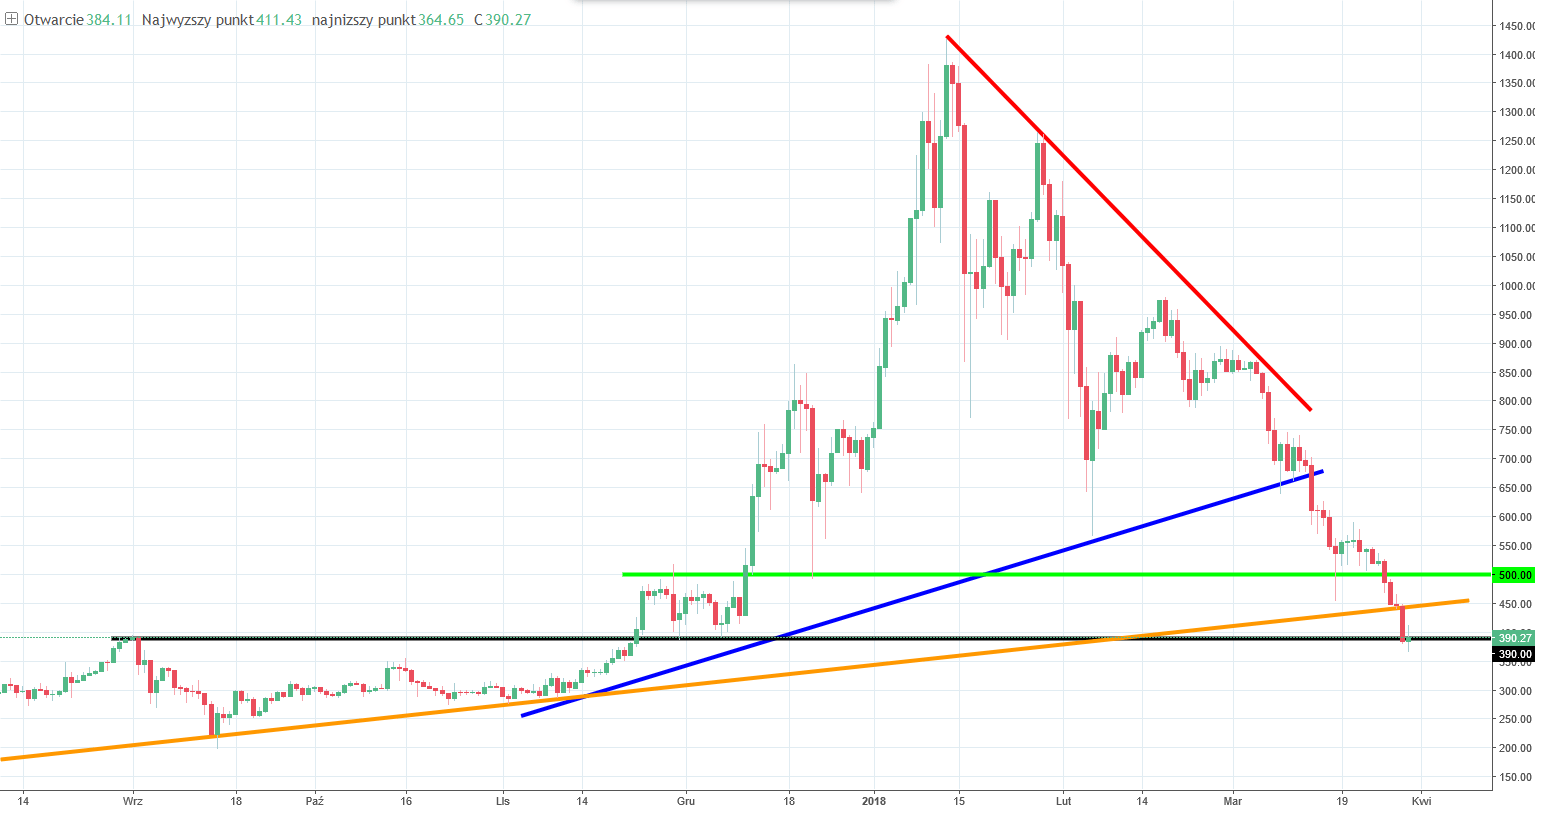
What was imminent, became a reality. Is it a coincidence that the price is on this support and tries a reversal by creating a pin bar? Well, can be. This may also be the influence of the end of the month and quarter or even end of the week, like on the Forex market (many market participants close their positions before the weekend). What will happen now depends from the today’s candle. If we will get a bullish reversal candlestick pattern, chances for a reversal will rise. A breakout of the 390 USD support will mean a movement towards the 200 USD… or even lower.
NEM, gone with the wind
The last time we wrote about NEM, we were on the top of the bullish correction. That moment was tricky. After such a strong correction, many traders had an illusion of a sustainable bullish reversal. Not us. When the NEM was trading around the 0.47 on the 14th of March, we were warning our readers about the unfounded optimism:
“As long as we stay below the 0.7 resistance, the sentiment is definitely negative and we have much bigger chances to test the 0.3 support again. „
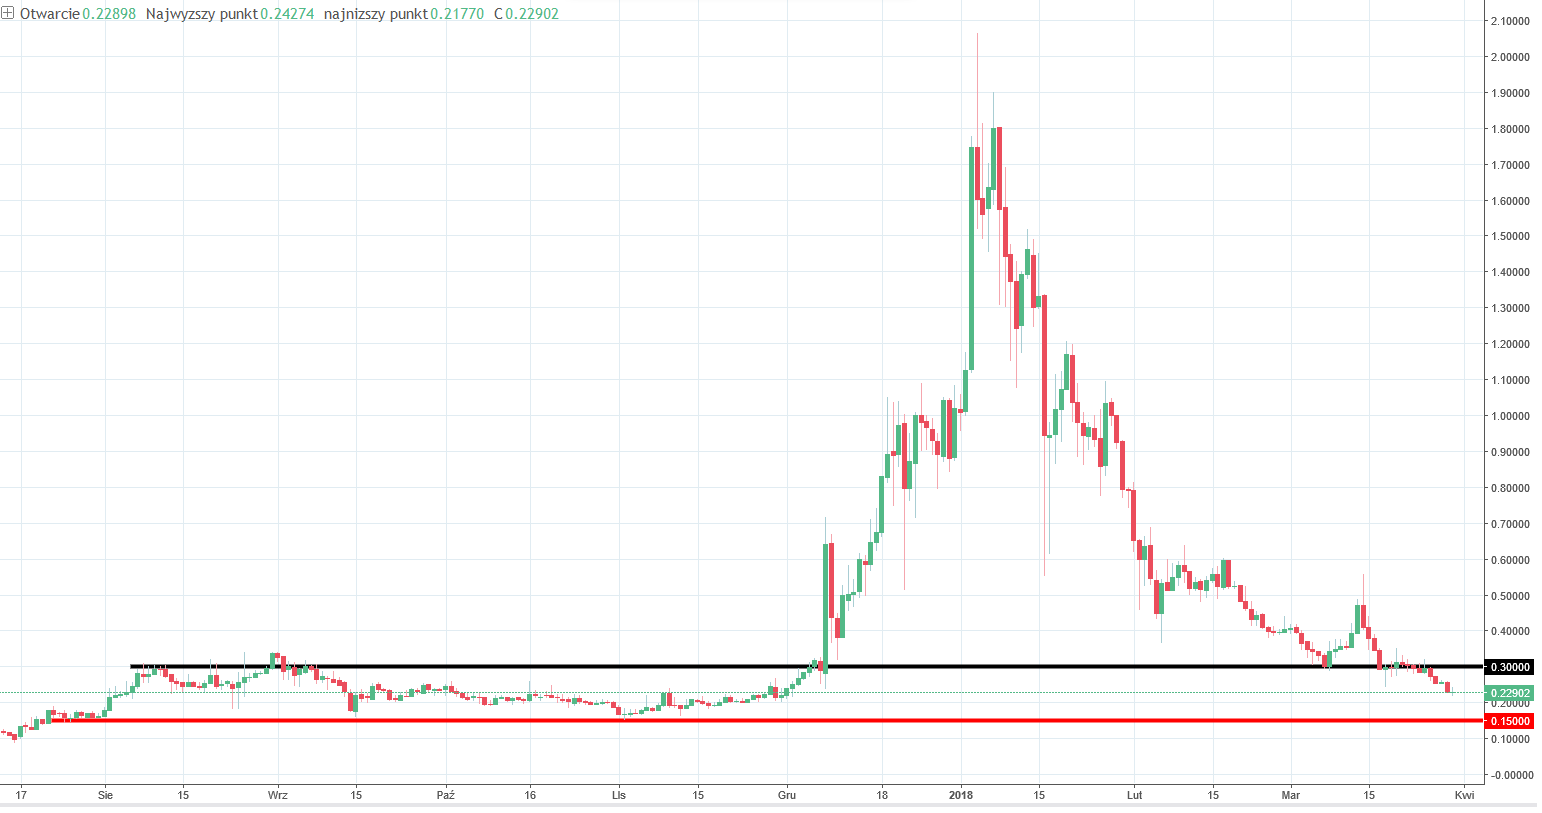
From the moment, when we wrote those words, XEM was going only lower! We broke the 0.3 support without any struggle and currently one coin is trading around the 0.22 USD. Current target is the 0.15 (red), which is very very close to ZERO.


Comments (0 comment(s))