CyberMiles Analysis – That drop can be just a beginning

Now, time for a newbie but in the same time, one of the biggest losers today – CyberMiles. The coin is down around 7% and it does not look like this suppose to be the end of the troubles here.
On the H4 chart of the CMT, we can see few bearish factors at once. First of all, the price broke the long-term up trendline (blue), which triggers us a sell signal. In addition to that, we are under the influence of the false breakout pattern (yellow). That was a denied attempt to break the horizontal resistance on the 0.35 USD (blue). The price went higher, but after few days, went back below that line, which showed us a bullish weakness. After that, 0.35 USD was successfully tested as a resistance.
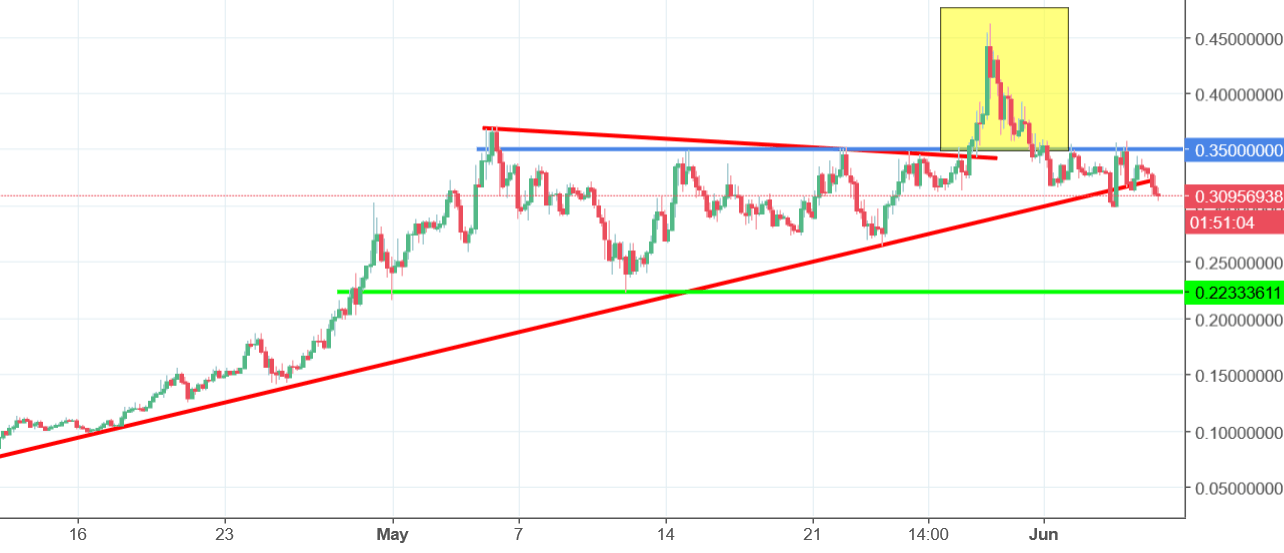
Current sentiment is negative and the potential target for this drop is much lower. In our opinion, in the mid-term, the price can even fall towards the area around the 0.22 USD (green). Sell signal will be denied when the price will come back above the 0.35 USD but the odds for that are very low.


Comments (0 comment(s))