DigiByte Analysis – Short-term bullish bounce

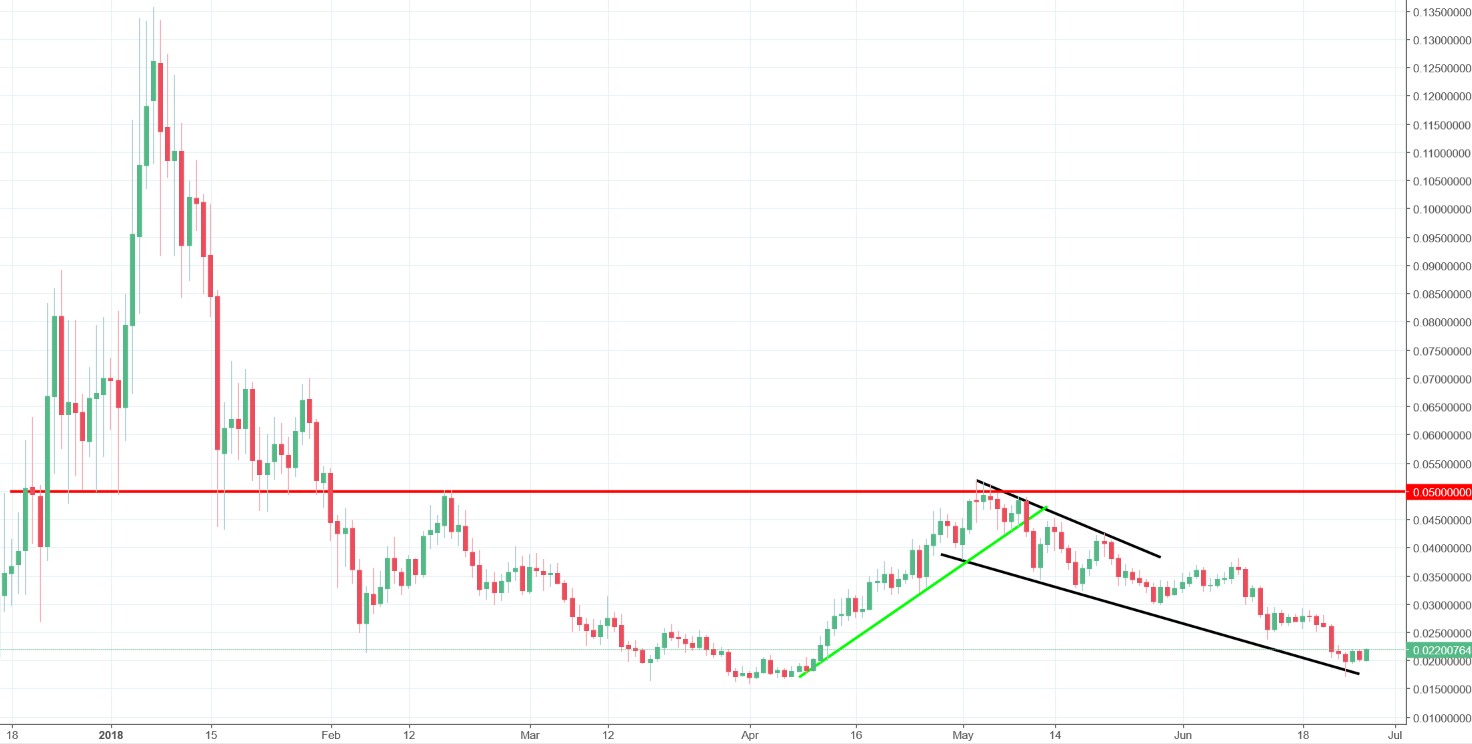
The last one is DigiByte, which today, is going up almost 9%! Previously, we mentioned this instrument on the 22nd of May and the price was inside of a bullish flag (black lines). We were optimistic about the future but in the same time, we highlighted the importance of the breakouts! That is the beauty of the price action. When you see a breakout of the resistance, you go long, if not, you do not. If there is no breakout, you patiently wait for it. Let’s recap our last analysis:
“The overall situation looks promising. Flag is in the same time a right shoulder of the giant iH&S formation. The neckline of this pattern is in the same time a crucial horizontal resistance (0.05 – red). Breakout of the red area can be a very strong buys signal, which can lead the price towards the all time highs. That looks definitely positive but before that happens, we need to see the price walking through the upper line of the flag. „
Quick look on the chart and you can see that there was no breakout, so there was no signal. Instead of that, thee price continued to decline and since the end of May, DGB lost around half of its value!
What is going to happen now?
On the 23rd of June, the price created a hammer candlestick, which was bouncing from the lower line of the channel down (old flag). The bounce can be a start of something good for the Hodlers. I am not saying that we should see the price on the red resistance but the short-term sentiment is positive and the buyers may be able to catch some breath in the nearest future.


Comments (0 comment(s))