EOS Analysis – Another trend continuation pattern

Now time for EOS. We are proud of the last analysis that we wrote about this crypto. It was on the 23rd of May and back then, the price was around 11,2 USD. This is what we wrote in our previous piece:
“The breakout, which is happening as we speak, confirms the sell signal that we gave almost 2 weeks ago. The potential target is the green line connecting higher lows from the March and April. „
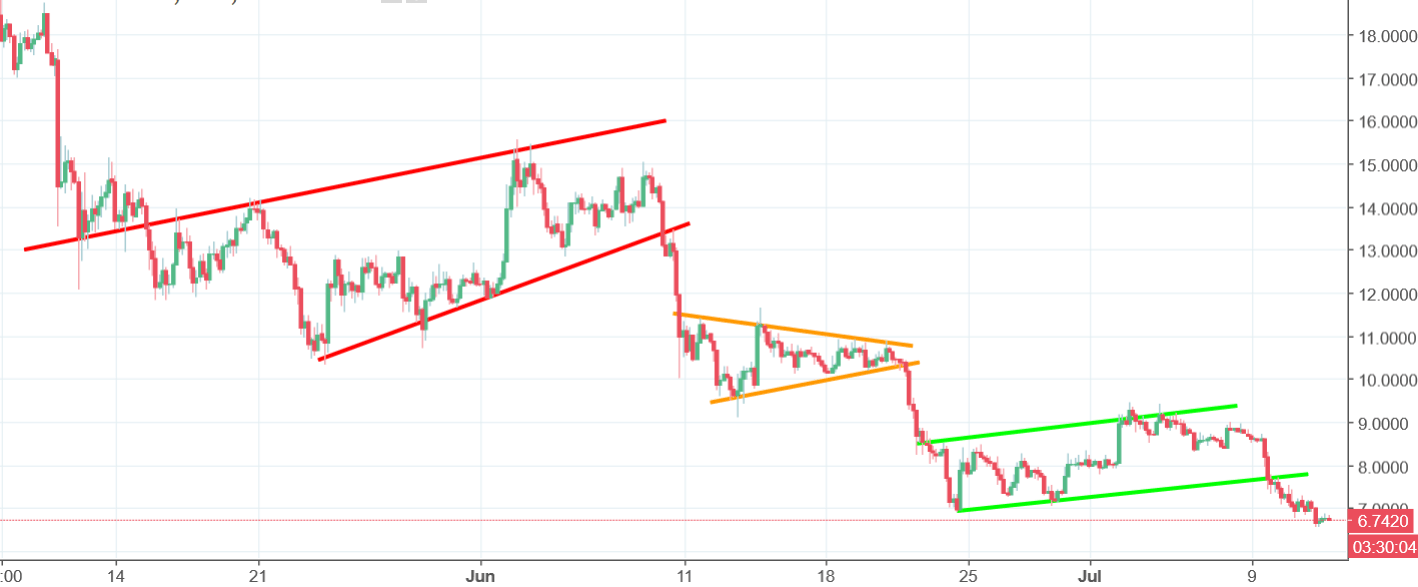
Since those words were written. The price was mostly going lower. Almost every day. In the meantime, EOS created three trend continuation patterns. All of them resulted with a breakout of the lower line. First one was a wedge (red), second was a pennant (orange) and the third one and the most recent one, was a flag (green).
Flag gave us a sell signal on the 9th of July. After that, the price made new lows, which confirms the sell signal. Negative approach will be denied, when the price will break the lower line of the flag, which for now, is less likely to happen.


Comments (0 comment(s))