EOS Analysis – Descending triangle confirms the sell signal

The second piece of the day is the EOS, where we also were bearish in our last analysis. In the review from the 11th of May, we wrote the following words:
“Those two supports being gone is a major sell signal so there is no surprise that the price is falling like a waterfall at the moment. We already managed to retrace the 50% of the recent downswing and it does not look like this is the last word of the supply.
On the EOS, we can get much lower but I would be careful with opening short positions now and personally, I would prefer to wait for the clear breakout of the 50% Fibo.”
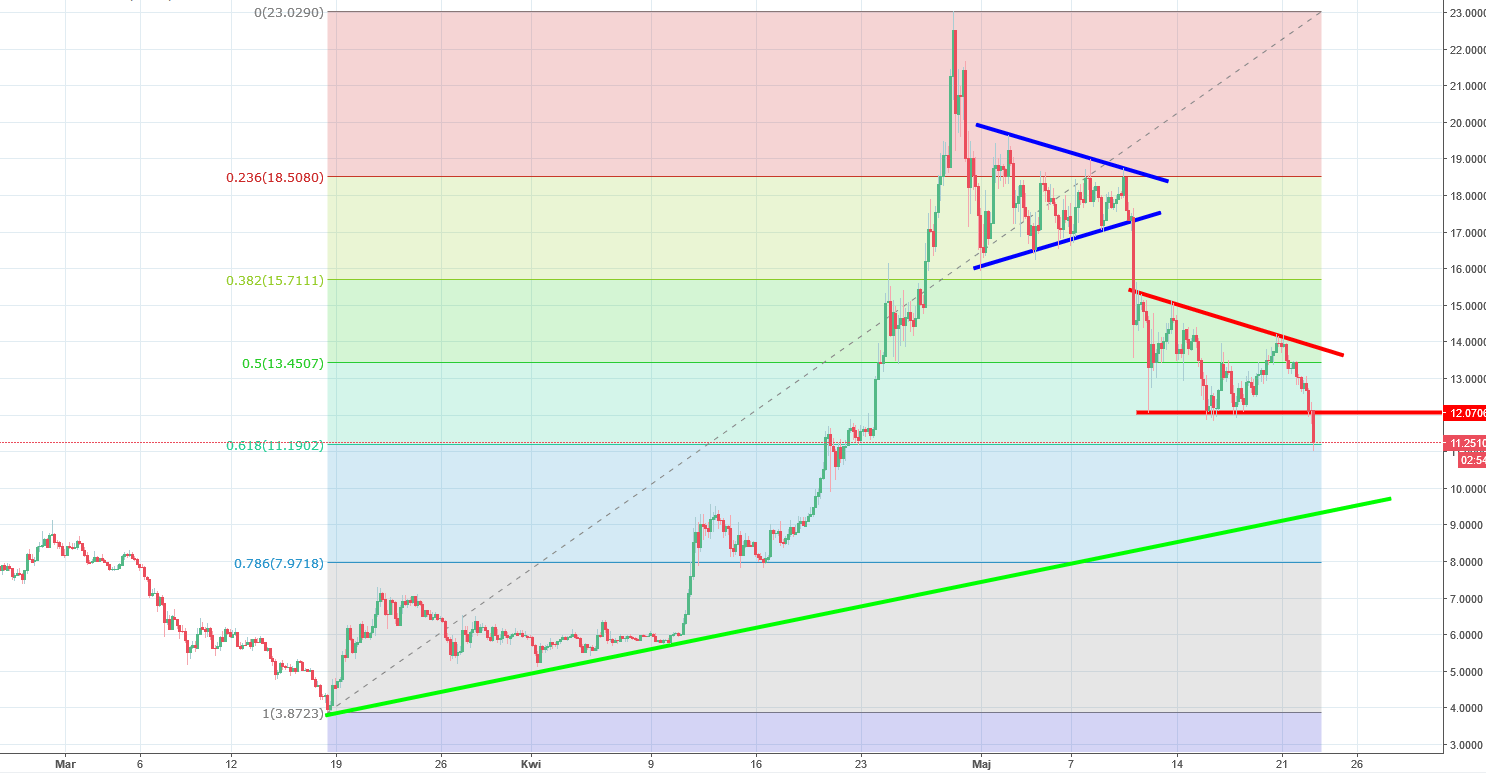
Back in that day, the price was around the 15 USD and the 50% Fibonacci was on the 13.44 USD. What is very interesting here, is that since those words were written, the price was only lower. You have to admit that it was a very good call. From the 11th of May, till now, the price created the descending triangle pattern (red lines) and did what was expected – broke the lower line of this formation.
The breakout, which is happening as we speak, confirms the sell signal that we gave almost 2 weeks ago. The potential target is the green line connecting higher lows from the March and April.


Comments (0 comment(s))