Ethereum Analysis – New yearly lows

New week, new trading occasions ahead! We start Monday with the piece about the Ethereum, which is currently on the lowest levels since the 17th of July 2017. Previously, we mentioned this crypto, on the 15th of October, when the price was going 20% higher. Does that mean that back in that day we were optimistic? Not at all! This is what we wrote back then:
„As long as we are below, there is no buy signal yet. Only the price breaking that line will give us a signal to go long. As for now, we have to wait because we do not have a sell signal either.
Fine but what should You do now? Well, the purpose of this piece was to calm down many investors that got or will get over excited with today’s rise. We are still low and as for now, there is no buy signal whatsoever.”
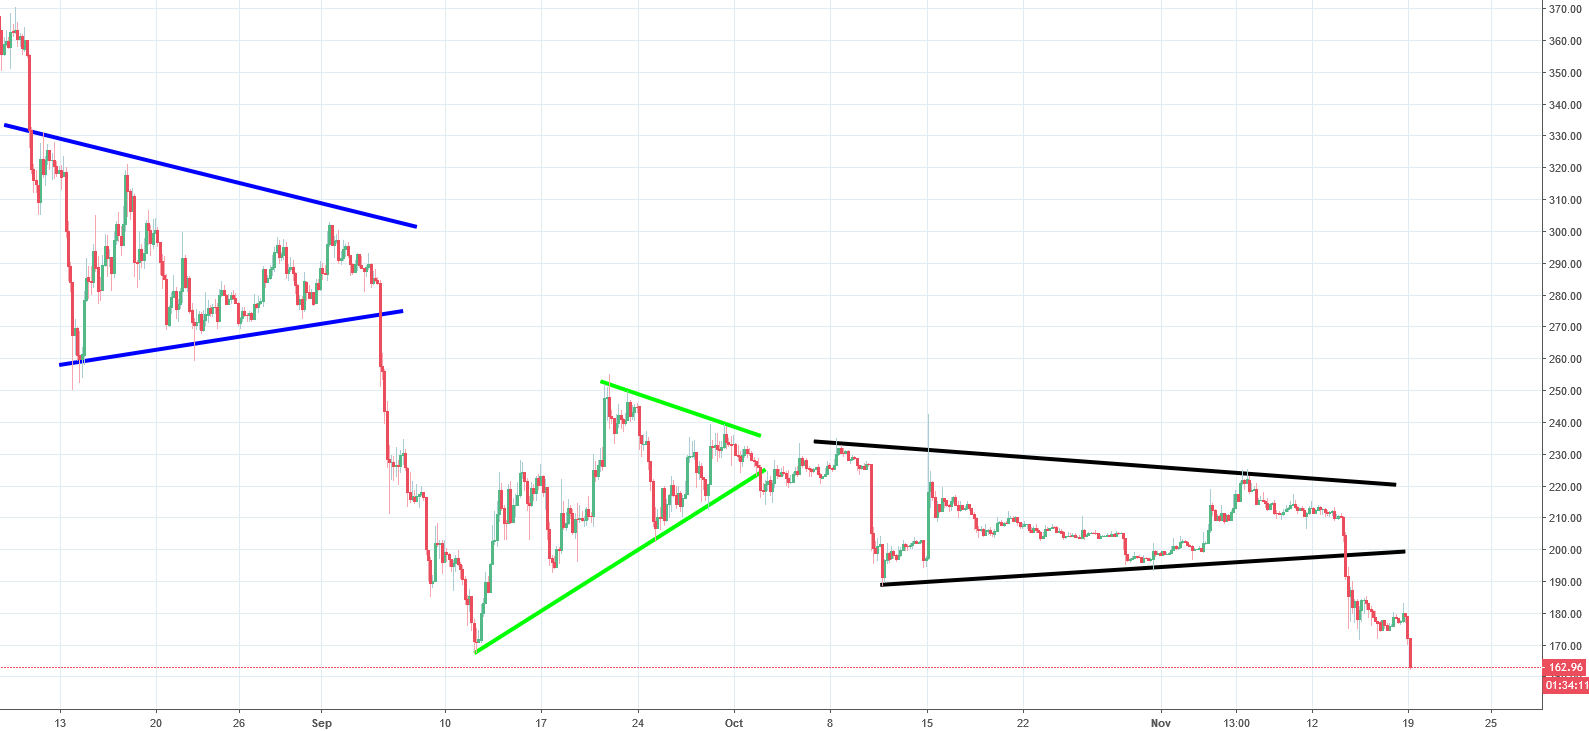
That was a great piece of work. After those words were written, the price was only going down. Till the 14th of November we had a symmetric triangle pattern (black) but on last Wednesday, price lost the breaks and went significantly lower. Today, ETH is breaking the bottom from September and is setting new yearly lows. Hopefully you read our piece from October and You did not buy ETH after that single day rise. The sentiment now is totally negative and ETH is the instrument that you should stay away from.


Comments (0 comment(s))