Factom Analysis – Typical bearish setup

Wednesday starts with the analysis of the Factom, which was previously mentioned on the 3rd of July, when the price was around 11.4 USD. Back in that day, we were positive and on our mind, we had clear target – 15 USD:
“Currently, the target is on the 15 USD (blue) and that is a static resistance created by the lows from the end of May. The price should get there fairly easy and that is a good news for the buyers as that would mean almost 40% rise. Seems like a good trading idea, especially that recent market conditions on the crypto market are not pleasant for the traders. „
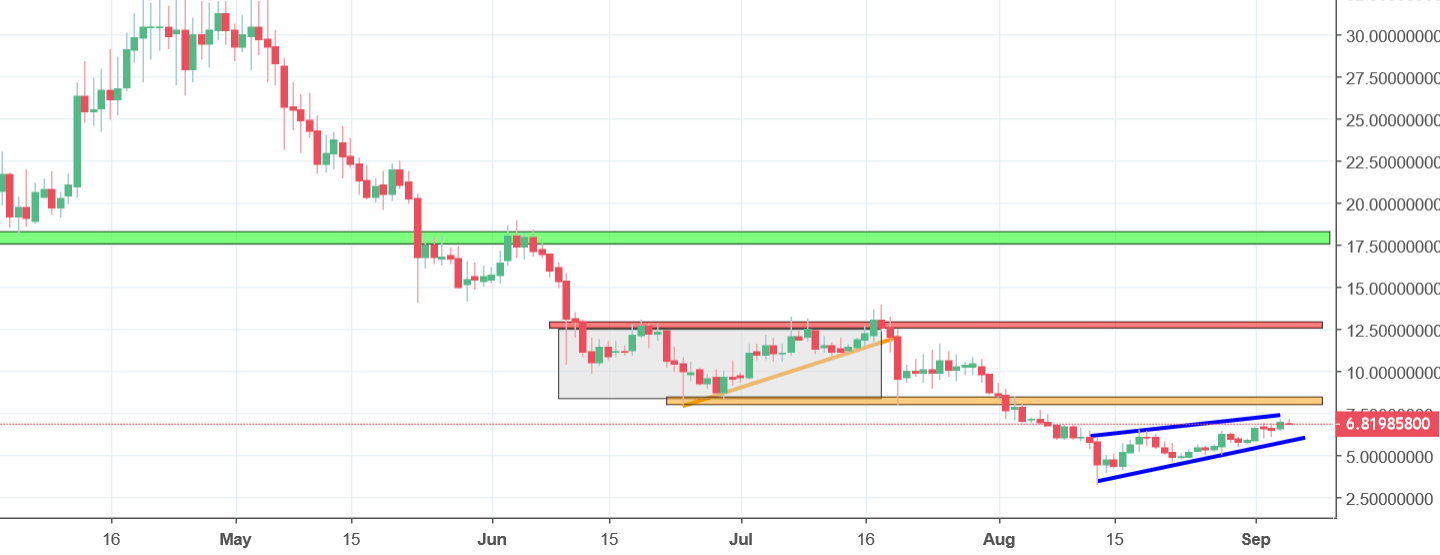
That was a good signal but unfortunately, our target was not reached. On the 18th of July, the price reached the 13.85 USD and that was it. Since the middle of July, the price is going lower. The downswing was trigger by the fact, that the FCT created a reversal pattern (iH&S) and later, failed to use it for an upswing. You know what they say, if the price does not want to go up, it will probably go down.
Most recently, we do have a flag formation (blue lines), which is promoting a further decline, especially that we are under the horizontal resistance on the 8.3 USD (orange). With this setup, we should soon see the breakout of the lower blue line and a further decline.


Comments (0 comment(s))