IOTA Analysis – Always look at the bright side of chart

Most of the coins are suffering heavy losses today but we have one crypto that can cheer you up – IOTA. One of very few today that is on the green side of the market, currently up 2,6%. The last time, we wrote about IOTA on the 5th of July, when the price was around 1,17 USD. Let’s see what happened since then, but first, check out our bearish comment from the previous piece:
“Flag is a trend continuation pattern so we should continue to go down. What is more, we are ahead of strong resistances. First one is the mid-term down trendline (red) and the second one is the horizontal one around the 1.32 USD (blue). Price getting there can be a great selling opportunity, our view on this is pessimistic. „
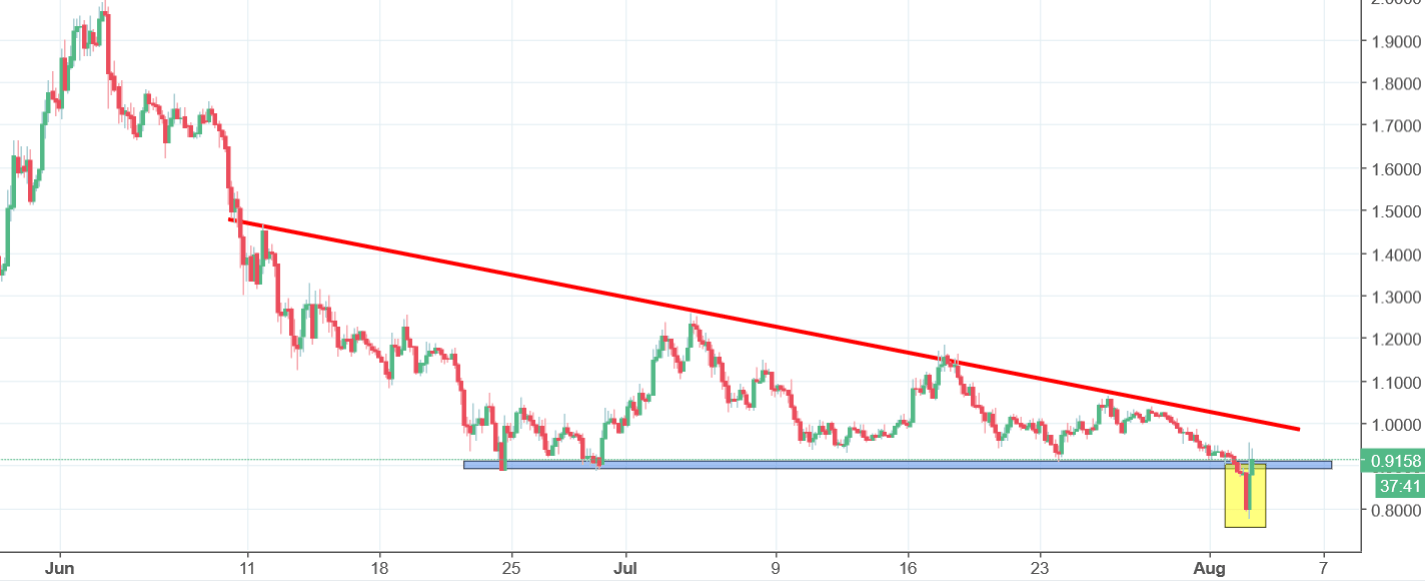
Since those words were written, thee price was mostly going down. Actually, 1,17 USD was the highest price back in that time, since then, we are only lower. In the meantime, the price managed to create a descending triangle pattern – very reliable bearish formation. Overnight, price managed to break the horizontal support of this formation (blue line), which triggered the sell signal.
Wait a minute, so why we are going up now? The thing is that this drop may be only a false breakout. In the middle of thee European session, the price is reversing sharply. If the buyers will manage to come back above the blue line – buy signal will be triggered based on the false breakout pattern (yellow). In other words: there is no trading signal yet but wait for the daily candlestick close. Above the blue line – buy, below – sell.


Comments (0 comment(s))