Komodo Analysis – Trying to escape from the rectagle

25th of July, that is the last time, when we analyzed Komodo. Back in that day, the price was slightly above the 1.6 USD and we were bearish. Mostly due to the fact that we had a negative pattern along with the bounce from the horizontal resistance:
“Currently, the price is closed inside of the flag (black lines), which is a trend continuation pattern, so it promotes a further downswing, especially that today, KMD strongly bounced from the horizontal area around the 1.83 USD. As long as we stay below the yellow area, the sentiment remains negative. „
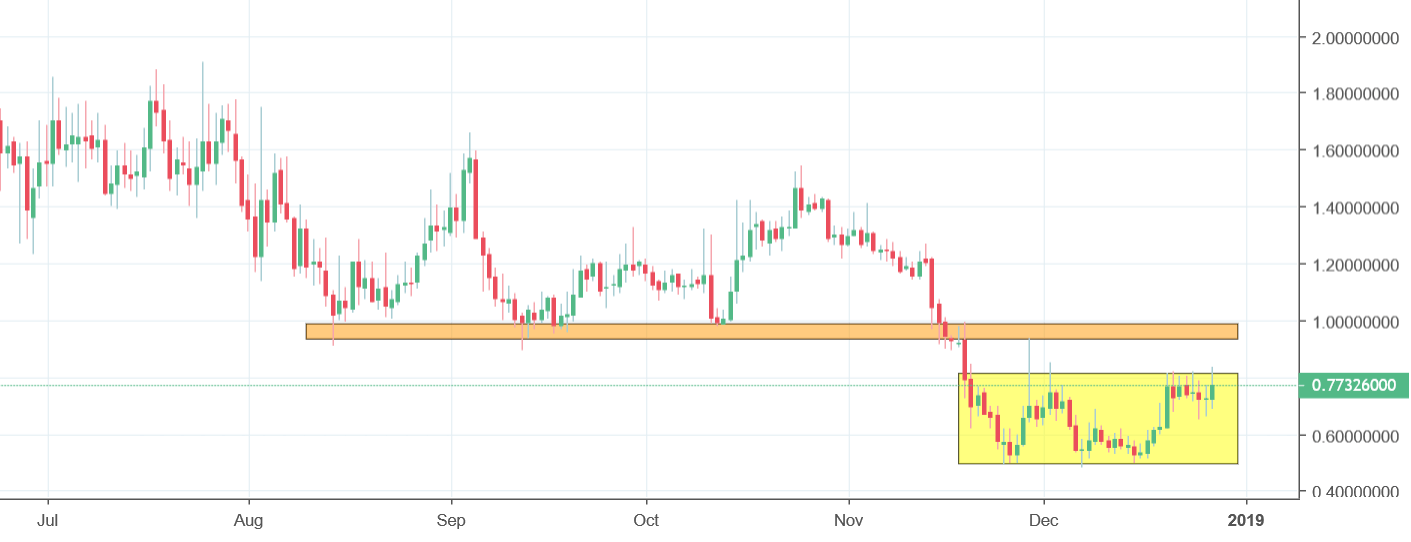
Hard to think about the better piece of analysis right now! The price did exactly as expected and almost straight away. After those words were written, the price never got higher and started a huge drop. A major breakout here was of the orange support, which was slightly below the psychological support of 1 USD. Since the middle of November, Komodo is in a tight range (yellow) and this tight range should end soon. Currently, the buyers are pushing higher, even despite the whole negative sentiment around the crypto. That is quite interesting and may be a sign of a local power here. Upswing is still on the table but even if it will happen, it should not go beyond the orange resistance. As long as we stay below, the sell signal is ON.


Comments (0 comment(s))