Lisk Analysis – Flag and a rectangle are pointing south

Today, we will present You three altcoins, which have a very similar technical situation. You will be amazed how big is the correlation between them. The first one will be Lisk, which we already analysed on the 30th of April. Back in that day, the crypto was trading around the 12.6 USD and we were bullish:
„The sentiment is positive but there is no buy signal yet. That one will be triggered, when the price will break the black line, which for now seems quite probable. Definitely more probable than breaking the blue one, on the 10 USD. „
Black line was the resistance on the 13 USD and it got broken shortly after our analysis was posted. Great timing. After that, we had few days of an upswing, which reached the resistance on the 15.55 USD (black line). That was the end of a bullish power. From that point, the price fell much lower, having only bearish days in the meantime.
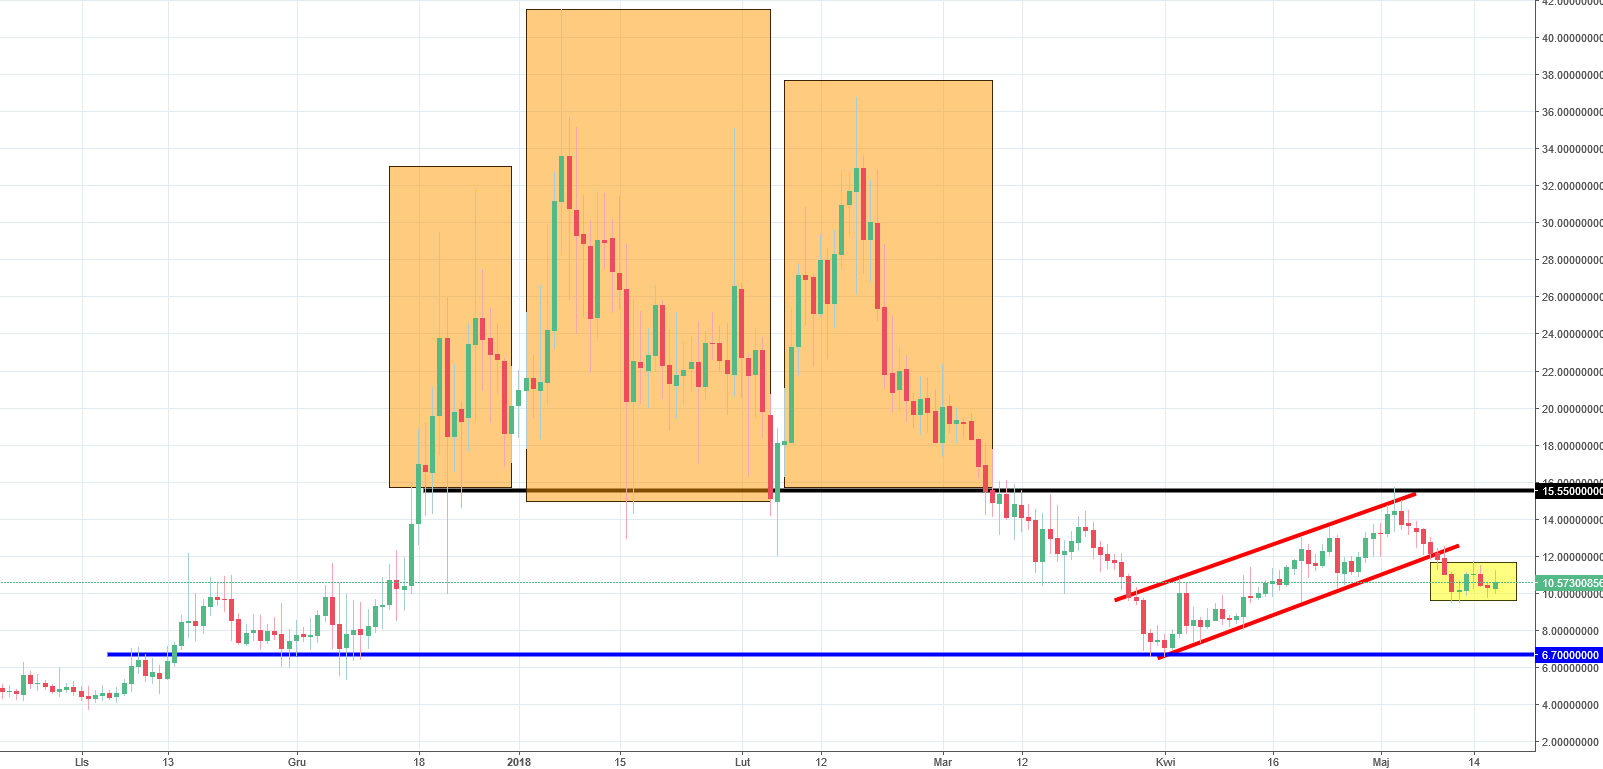
Price swings from the beginning of April till the beginning of may shaped the flag pattern (red lines). In this situation, that pattern was bearish as it was formed after a heavy drop. In this case, the breakout of the lower line of this pattern was not a surprise. Currently, the Lisk is forming a rectangle (yellow), which also promotes the downswing and that is the current scenario for this crypto. In our opinion, the next resistance on the 6.7 USD, should be reached relatively soon.


Comments (0 comment(s))