Lisk (LSK) Analysis – Another buy signal

Second analysis of the day is about the Lisk, which for the last time, we analysed at the end of May. Back in that day, we warned about the possibility of a further drop, mostly due to the failed bullish pattern:
“In theory, that is positive but we can see that the price fails to climb vastly higher, showing us a bearish dominance. A failed bullish pattern can add additional fuel to the downswing. Sell signal will be denied when the price will climb back above the 10 USD but the odds for that are currently low. „
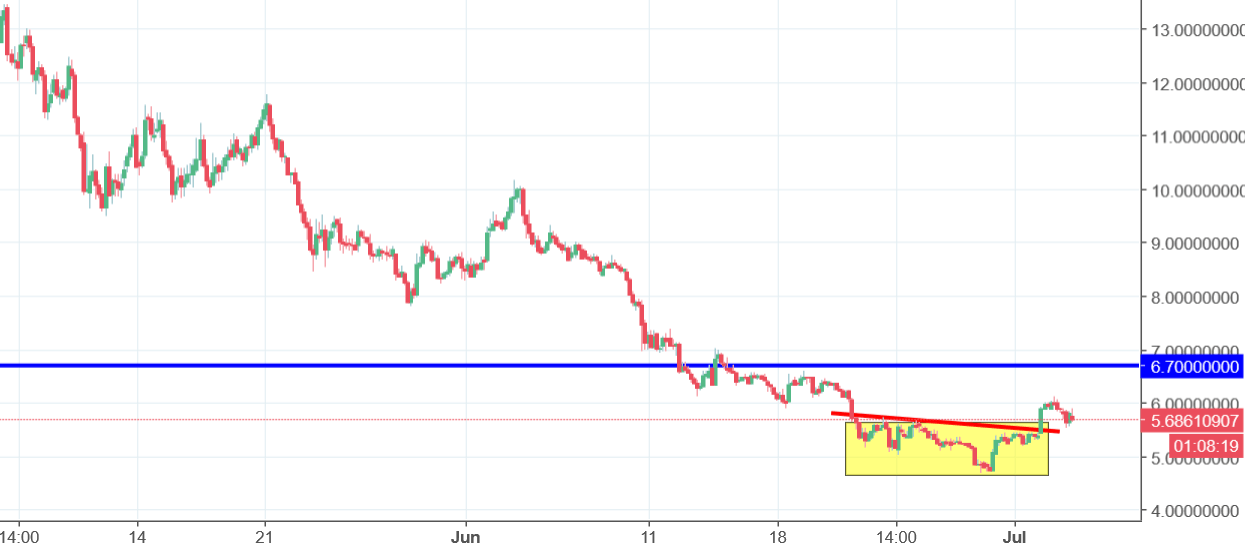
When those words were written, the price was on the 8.6 USD. On the 29th of May, we were as low as on the 4,7 USD. Indeed, a great sell signal. Now, we do have a spring on the whole crypto market and the Lisk is going up too. LSK created a bullish reversal pattern – double bottom (yellow). Formation is already active as the neckline (red) was broken two days ago.
The closest target for now is the 6,7 USD (blue). Maybe you do not see an importance of this level here on this chart but if you look on the previous analysis, you can see that this level is crucial for the long-term situation on this coin.


Comments (0 comment(s))