Litecoin Forecast – 170 USD in the game, waiting for a breakout
A ray of hope can be seen today on Litecoin. The coin is up almost 2% and is about to have a second positive day in a row. Whoah, you have to admit that in terms of the cryptocurrencies it sounds funny but hey, that is the current reality on this market.
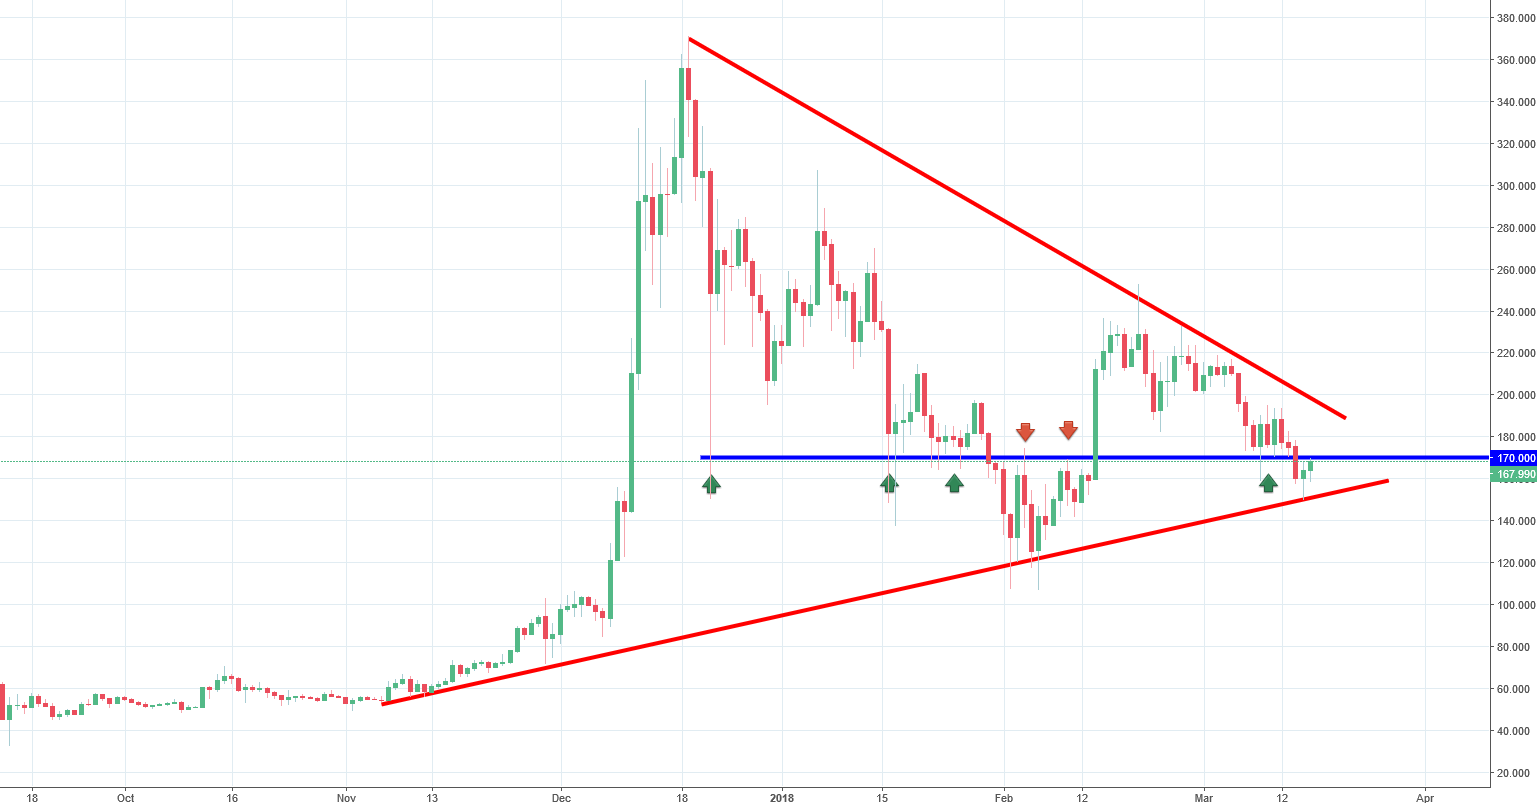
Litecoin also suffered a lot since the middle of December. We went from almost 380 USD to around 100 USD in a month and a half. Quite a wild ride. Currently, Litecoin is in the sideways trend – symmetric triangle pattern (red lines). The hope mentioned in the first paragraph comes from the fact that yesterday, LTC bounced from the lower line of the triangle and created a hammer candle on the D1 chart. That should take us to the upper line of this formation, so around 200 USD. Should but not necessarily has to happen. We have a huge obstacle on the way: resistance on the 170 USD (blue). It is an important S/R level since the end of December. Few days ago, it was a support, now we have a chance to test it as a resistance.
What is next?
For the long-term trading signal, blue line is not so important. Buy signal will be created once the price will break the upper red line and the sell signal will be created once the price will close below the tail of the yesterday’s candlestick.


Comments (0 comment(s))