Loom Analysis – Broken down trendline but…
Friday, for us, starts with the Loom. It is the first analysis today and the first analysis overall for this crypto. Loom is relatively a new coin on the market but already the market cap is significant and what is more, the price is already respecting the price action principles. Unfortunately for the new hodlers, the perspectives are not bright.
Loom is in the deep downtrend since the 4th of May. The price was going down nicely, using the black down trendline as a resistance. In the meantime, the price created three technical patterns (pennant -red, flag – blue and another pennant – green). All of those formations finished with the breakout of its lower lines, which only confirmed the sell signal.
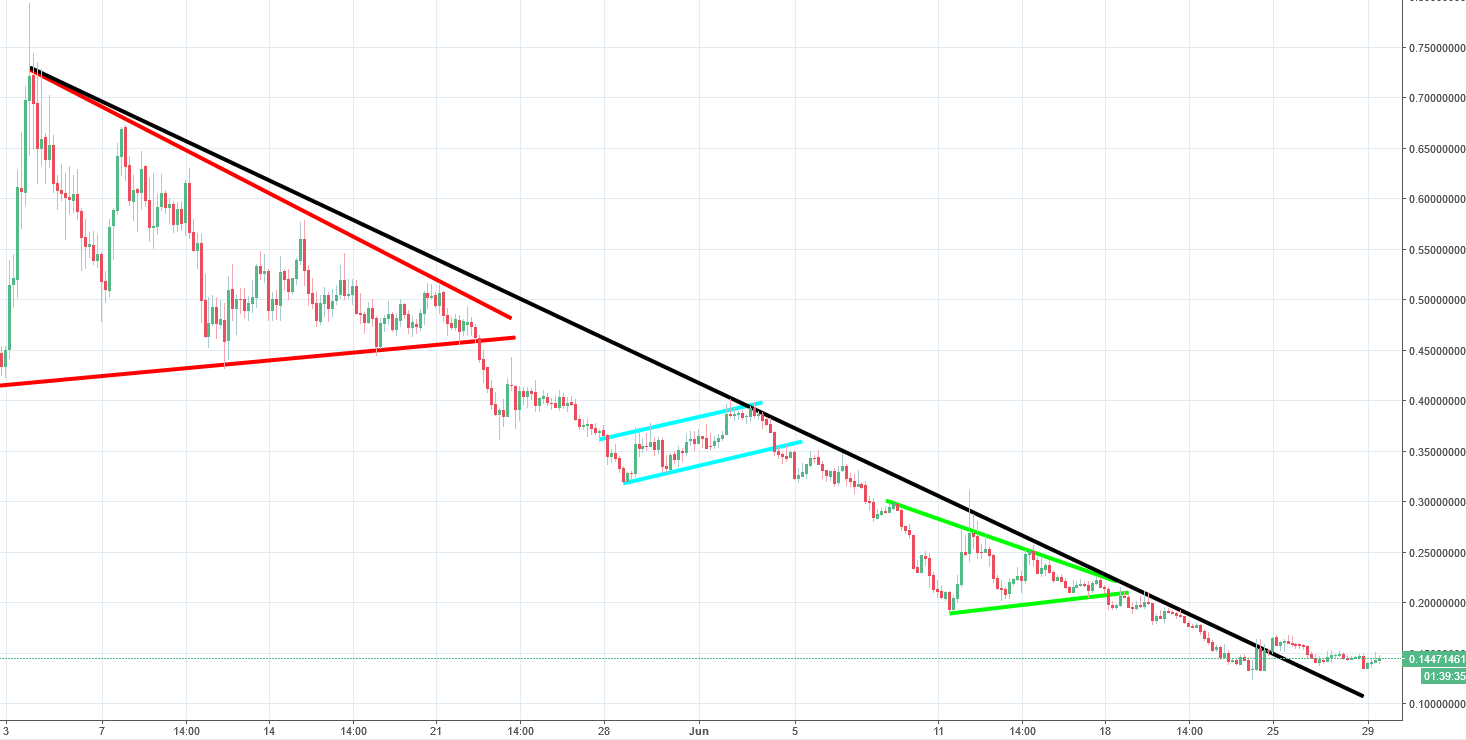
On the 24th of June, the price broke down trendline but in my opinion, that breakout is not significant and should not trigger us a buy signal.
Why I am not convinced?
According to the technical analysis, if trend suppose to be reversed, we should see much stronger upswing. After the breakout, the price entered a very flat sideways trend, which shows us that there is no demand here. The buy signal is not here and the price should continue to go down.


Comments (0 comment(s))