MonaCoin Analysis – Perfect descending triangle pattern
We finish this round of the Friday’s analysis with the iece about the MonaCoin, which also is a new guest on our portal and will be discussed here for the first time. To be honest with you, there is no reason to explain what is this coin and token and what does it do and what is the idea, white paper or team behind it. Price does not care about that.
Situation here is negative. Most recently, the MONA created a descending triangle pattern (blue horizontal support and black dynamic resistance). In line with the expectations, the price broke the lower line of this pattern and went lower. Yesterday, MONA was one of the best altcoins on the crypto market, which can be seen in a bullish reversal aiming the lower line of the triangle. That is a typical movement for the price action – broken support is tested as a resistance. Test was positive for the sellers and the price bounced from the blue area.
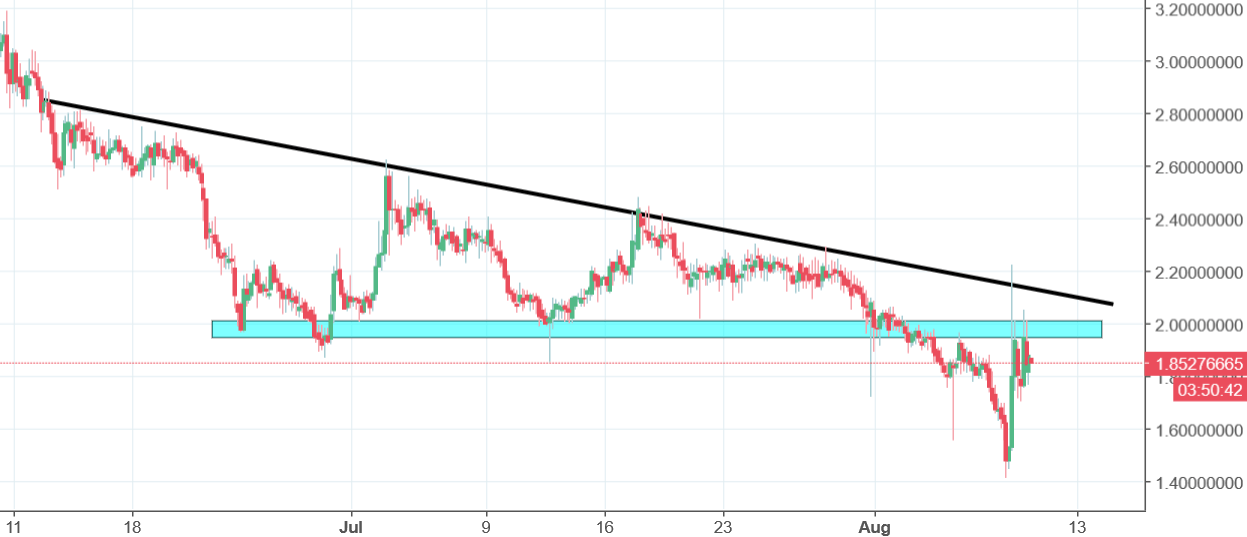
Friday starts below the blue resistance, which is a negative factor and thanks to this, the price should continue the downswing. Sell signal will be cancelled, when the price will break the black line, which for now is less likely to happen.


Comments (0 comment(s))