Monero Analysis – Wednesday’s top performer

Second piece on Wednesday will be written about the Monero, which we discussed quite recently, on the 11th of April. That was before the altcoins reversed so the technical situation on the chart was negative:
“XMR has a legitimate sell signal and we have much higher chances of going even lower than we are now. Technically, we are under the influence of the bearish breakout from the long-term symmetric triangle created at the end of the last year (green and black lines). „
The price being below the trendline and straight after the bearish breakout from the symmetric triangle is always a sell signal. Any market, any instrument, any timeframe. That works 90% of the time. Monero is the example of that 10% that did not listen to the laws of the technical analysis. The price did not test the red support around the 153 USD and went higher. Instead of testing a support, traders decided to test the resistance (green, lower line of the triangle). That line was stopping the upswing for many days but finally, the buyers performed an ultimate attack…today.
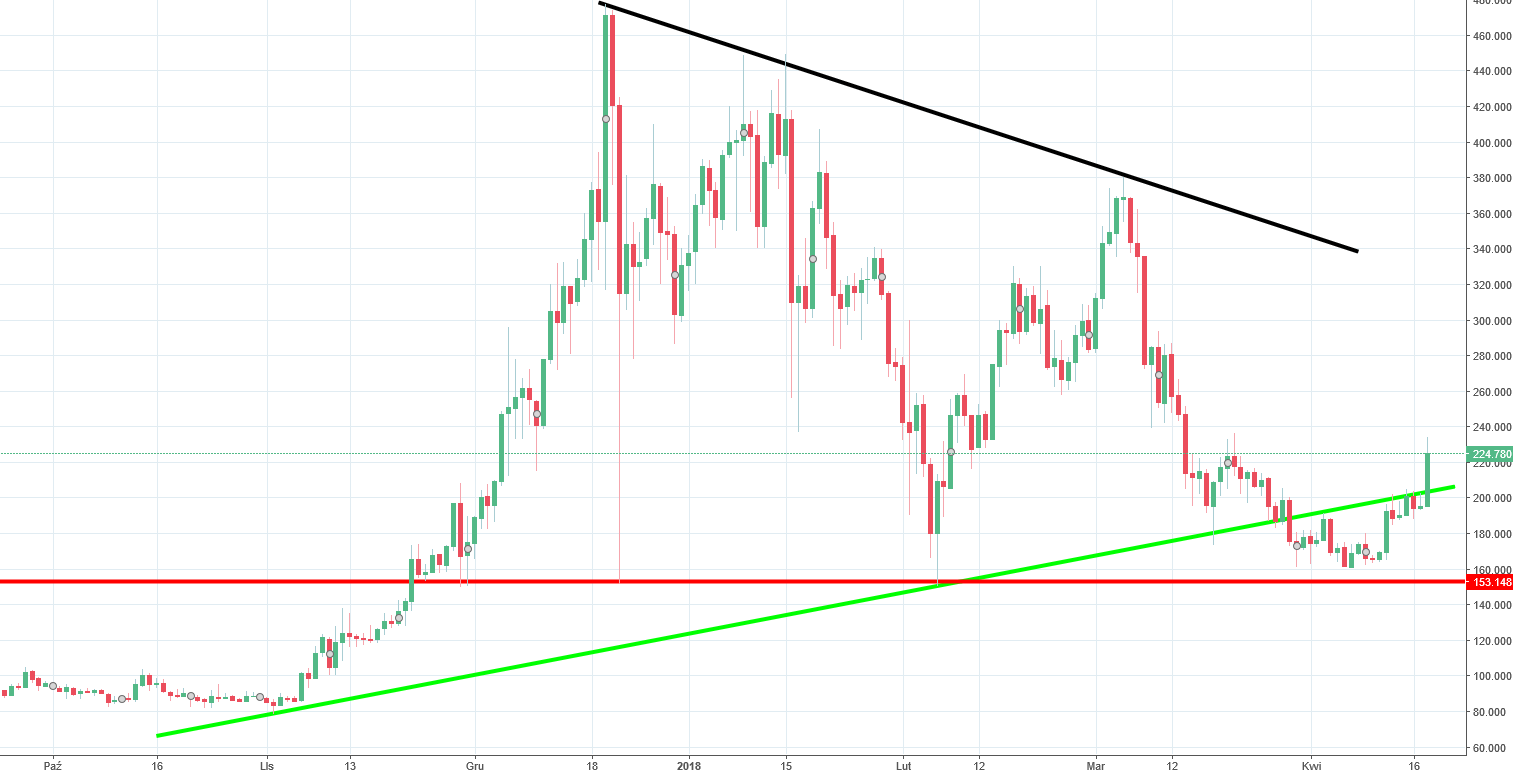
Yes, the buy signal is being created as we speak, the price is already back inside the triangle. As for now, Monero is up 16%. If the buyers will manage to end the day inside of the triangle, that will create a long-term buy signal, based on the false breakout pattern seen in the beginning of April.


Comments (0 comment(s))