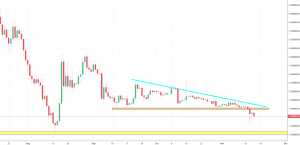
Ontology Analysis – Descending triangle shows the direction

Crypto market suffers now from the Bitcoin breaking the ultimate horizontal support and making new yearly lows. The scale of the sale is somehow small though. We do not see any panic and the drops look moderate. Today, we will focus on the Ontology, which on Friday is down 5%. This is one of the biggest declines today, so you see that the sentiment is not so bad! Previously, we mentioned this instrument on the 27th of August and we were positive:
“This breakout is a technical invitation to go long on this instrument. The potential target for this upswing is higher now and is the blue resistance on the 4 USD. Chances that we will get there are quite high. „

The price went higher but just in a short-term. In overall, that analysis was not the best one on the record. ONT was on our radar many times. Usually we were right in predicting the direction but not that time. After setting local highs on the 28th of August, the price went lower. ONT created a descending triangle pattern (orange and blue), so the formation promoting a further drop. The breakout of the lower line of this structure happened 3 days ago. That sorts out the bearish sentiment for the next few days. The ultimate target and the last crucial support is the yellow area, which was important here in March an August. Chances that we will get there are quite high.


Comments (0 comment(s))