Ontology (ONT) Analysis – Test of the 5.5 USD resistance
Today, I will analyse three newbies on the Crypto market and on our website. They are new but the situation on them is very technical and clear. I am really surprised that those coins are strictly following the price action rules, which makes them a very interesting instruments for trading. First one is Ontology (ONT), where today, the price is already around 7% higher than yesterday.
Since the beginning of May, ONT is in a very technical downtrend, which respects the down trendline and creates a bearish trend continuation patterns. Both of them were flags (orange lines) and both of them resulted in the breakout of the lower line and a further drop. What is more, ONT is respecting round levels! The closest resistance is the 5.5 USD (red). Previously, the crucial one was the 8.5 USD (green) and the most important support at the moment is 4 USD (blue).
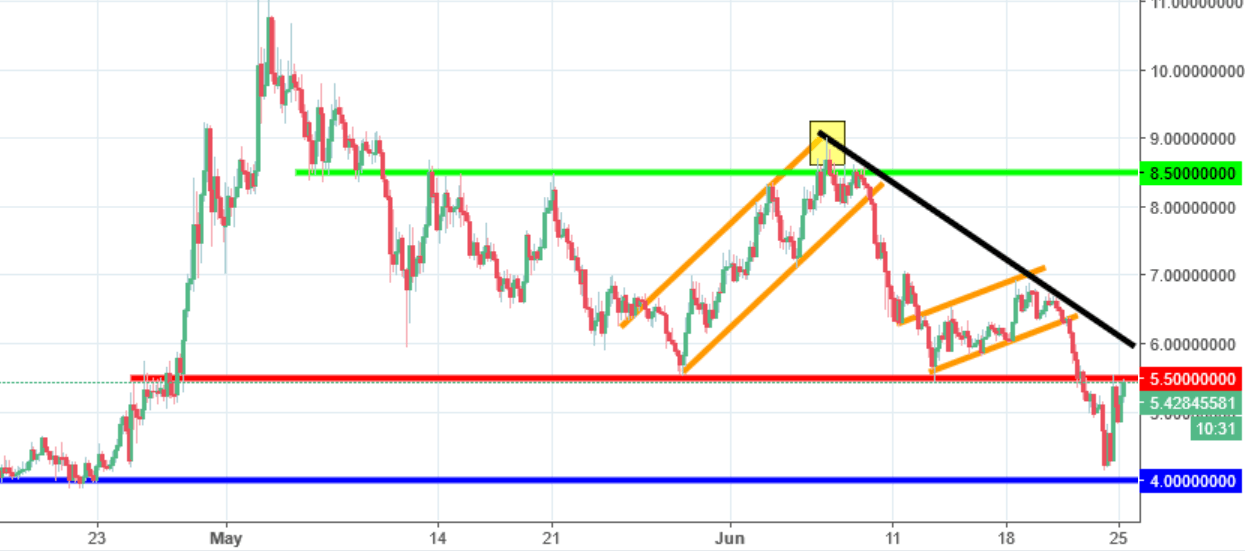
Currently, the price is testing the 5.5 USD, which creates an interesting occasion to sell. The sell signal will be on,only when the price will create a reversal pattern. For now, it is a bit too early to say who will win here. As we said earlier, a bounce will give us a signal to go short and a breakout will do the opposite – trigger a signal to go long.


Comments (0 comment(s))