Qtum Analysis – Sell signal and the 18 USD on the target

Another cryptocurrency that will make a debut in my analytical work is Qtum. As you could expect, the overall situation here is not much different from the others. History is the same, huuuge profits on December and January and then a following carnage erasing almost everything. Currently, we can see a recovery. Wait, to be honest with you, it seems like we saw recovery and since the 7th of May, we are back in the negative territory.
The current technical situation on the chart let me believe that the recovery that started in the middle of the March, ended on the 7th of May. During that time, the price rose from 10 USD and touched the resistance on the 24 USD (blue). 24 USD looks like a really strong barrier and the bounce from that can be perceived as a comeback to the bearish trend. In addition to the bounce, the price broke the mid-term up trendline (pink), which is definitely a negative sign.
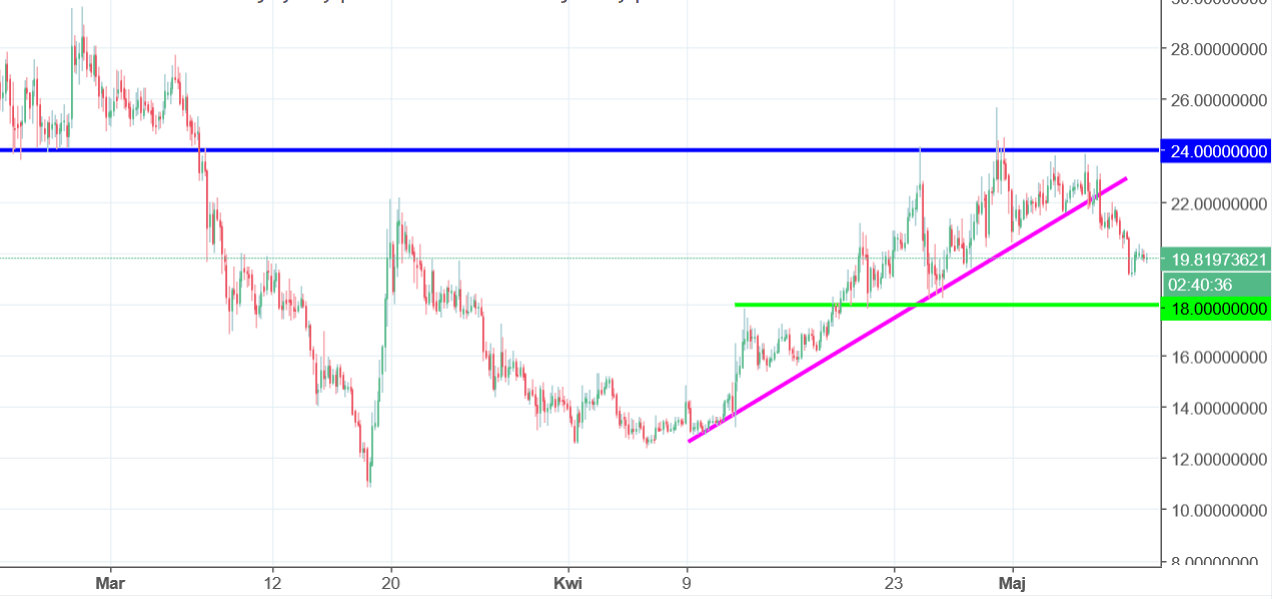
The closest support for now is the 18USD. That is the current target and the chances that we will get there are very high. The sell signal will be denied, once the price will break the resistance on the 24 USD but the odds for that are very, very low.


Comments (0 comment(s))