Qtum Analysis – Start of a bigger reversal?

Thursday starts with the analysis of the Qtum. This crypto was previously mentioned on the 22nd of October, when the price was around the 4.6 USD. Back in that day, we were bullish as we saw a nice inverse head and shoulders pattern. This is what we wrote back then:
„Qtum starts this week with a buy signal, being above two major supports. With this kind of setup, we do have high chances for a further surge. Buy signal will be canceled, when the price will come back below the blue line, which as for now is less likely to happen. „
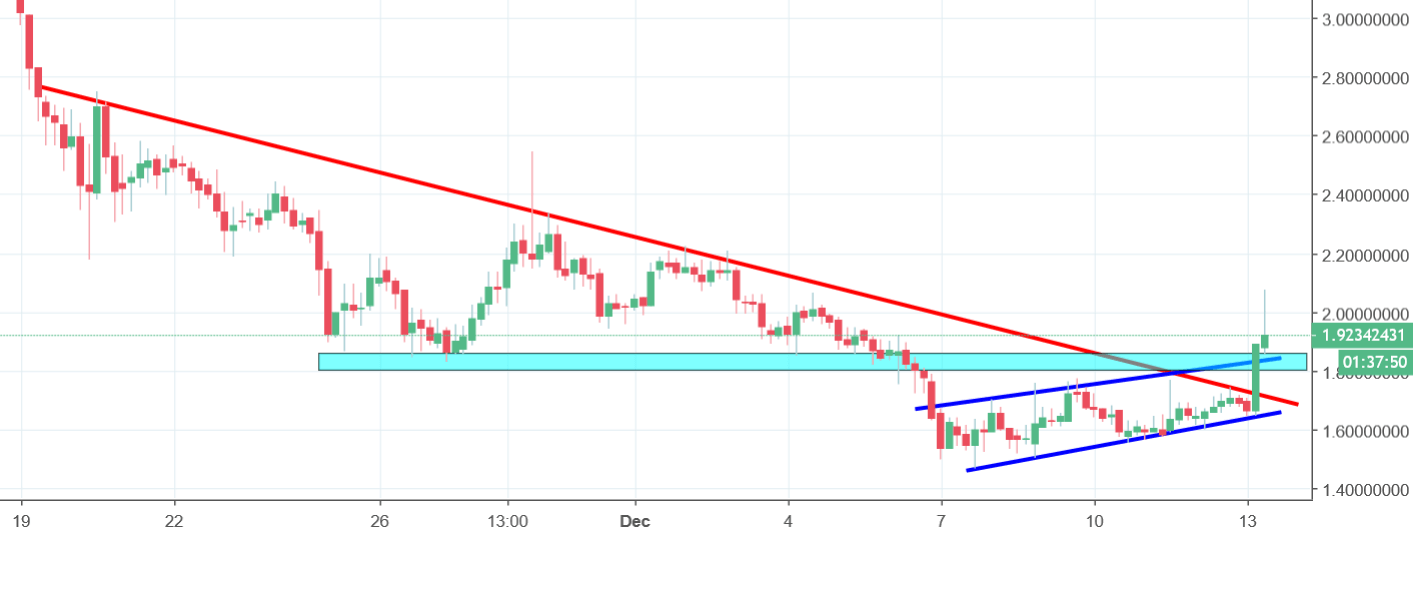
Now, the price is on the 1.9 USD. Does that mean that our previous piece was a failure? Pretty much yes. That one goes to our box of shame. Luckily, you are fully aware of the fact that most of the time, we are right. Anyway, today, Qtum is one of the best cryptos and actually again, we do have a buy signal here. The positive sentiment comes from the breakout of the mid-term down trendline (red). In addition to this, we broke the horizontal resistance (blue). To make the story even more bearish, we also have to mentioned the failed flag (blue lines), which instead of a drop, resulted with the breakout of its upper line. All that together gives us a proper buy signal, which will be present, as long as we will stay above the blue horizontal line.


Comments (0 comment(s))