ReddCoin Analysis – Bounce from the 0.004 USD
Friday starts with the analysis of the ReddCoin, which for the last time, was mentioned here on the 20th of August, when the price was around 0.0028 USD. Back in that day, we saw a chance for a short-term upswing but in the same time, we kept our negative scenario in the long-term:
„As for now, we are up almost 10% in one single day, nice. We do have few resistances ahead though. The price is aiming the orange and blue down trend lines and the black horizontal resistance. As long as we stay below the last one, the sell signal is still ON. „
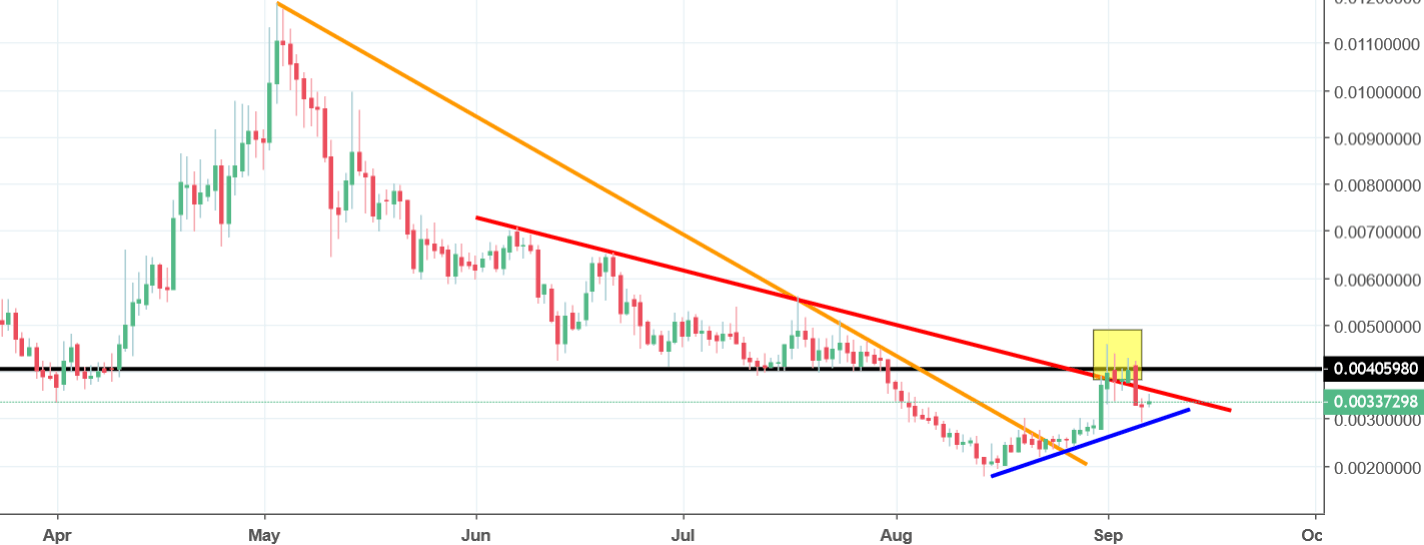
That is what happened! The price indeed went higher. At the beginning of the month, RDD tested the horizontal resistance on the 0.004 USD (black). For few days, the price was putting pressure on this area but eventually sellers managed to defend this line and the price went lower. Yellow rectangle, can be considered as a false breakout pattern, which is a direct driver for a new downswing. Currently, the price holds above the blue line but the price movement is telling us that this one should be broken relatively soon.
The new sell signal, will be triggered, when the price will break the lower blue line. Chances for that are quite high.


Comments (0 comment(s))