Ripple Analysis – What a rise!

Tuesday starts with the analysis of the Ripple, which was previously mentioned slightly more than a month ago. Precisely on the 15th of August, when the price was getting ready for a bullish reversal. We acknowledged that in our last analysis:
“This kind of a structure shows us, that lower levels got rejected and buyers finally found this asset attractive. Today, the rise is continued, which may be an invitation for a larger reversal. The current target for this upswing is the resistance on the 0.43 USD (blue). Short-term positive sentiment will be denied, once the price will break the yesterday’s lows. „
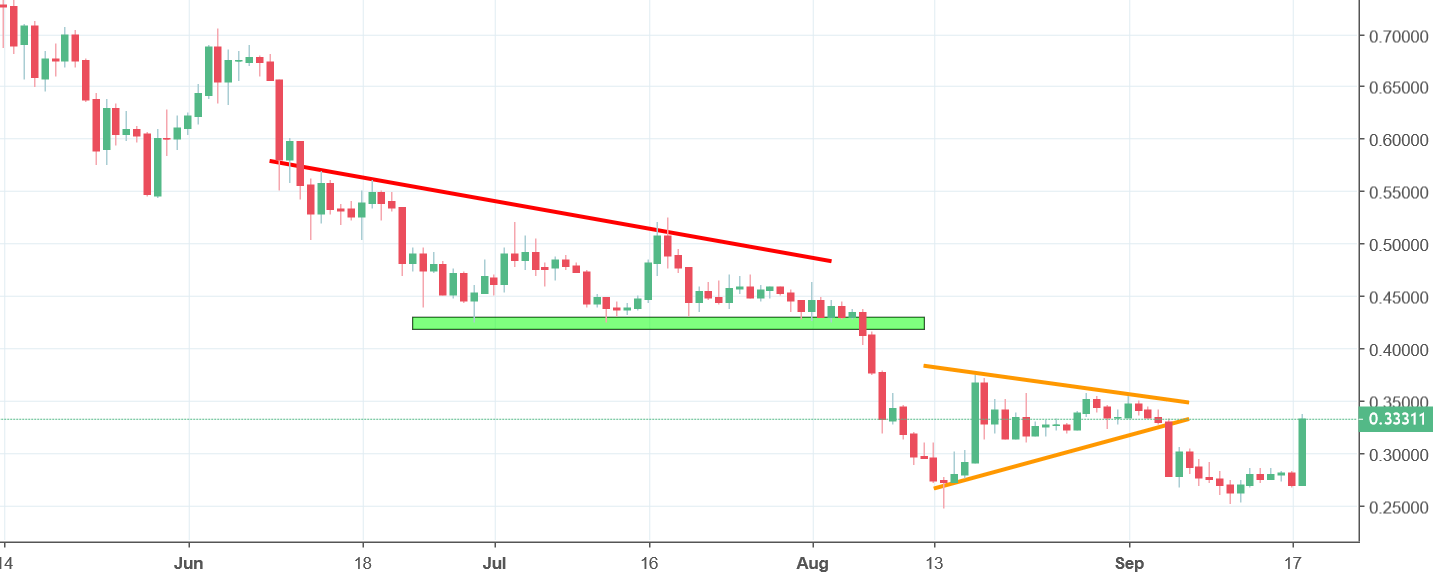
That was a great call! Next few days, after those words were written were bullish and the price went significantly higher. We almost reached the 0.43 USD resistance mentioned above. That is probably still to come as currently, the price is over 20% higher and it looks like terrible days for the XRP are over. Currently, we do have high chances for a double bottom formation and a bullish reversal scenario. This positive sentiment will be denied when the price will touch today’s lows, which currently is less likely to happen.


Comments (0 comment(s))