Siacoin Analysis – Broken supports

The last piece of the day, will be the Siacoin, previously mentioned in the beginning of August. The price was on the 0.007 USD and we were negative:
“If You think that we cannot go any lower, most probably you are mistaken. In my opinion, the price should continue to go down, at least till the support on the 0.003 USD (blue). With the current sentiment and momentum, the chances that we will get there are very high. „
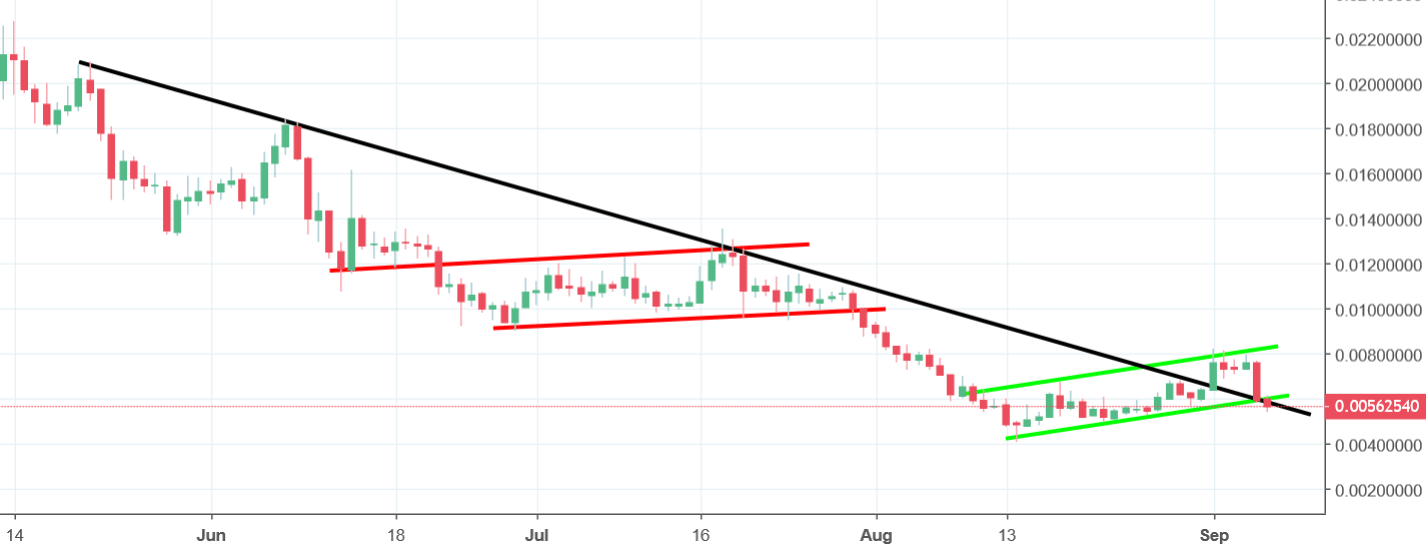
Another day, another dollar. Great piece from our analytical team. After those words were written, the price was declining almost every day till we reached the local lows on the 14th of August. Since that, the price was in a bullish flag (green lines) but that was only a correction. Today, the price is breaking the lower line of the flag and the mid-term down trendline (black). Both of those actions are definitely negative. Sell signal is on, which means that we should seen the new lows soon.


Comments (0 comment(s))