Status Analysis – Flag or a triangle?
Monday starts with the analysis of the Status, which was previously mentioned here on the 17th of September. Back in that day, the price was around 0.034 USD and we were pessimistic. Today, the price is higher but was our analysis entirely wrong? Let’s see how we concluded the previous piece:
„Current correction is just a small pause. We do not see any bullish reversal pattern whatsoever. Our view remains negative and in our opinion, new long-term lows are just a matter of time. „
No, our outlook did not change, we are still bearish here. Currently, the price is on the 0.04 USD and nothing really changed. The bullish correction is continued and we do not have any signs of reversal. It look like, this will end up with a drop.
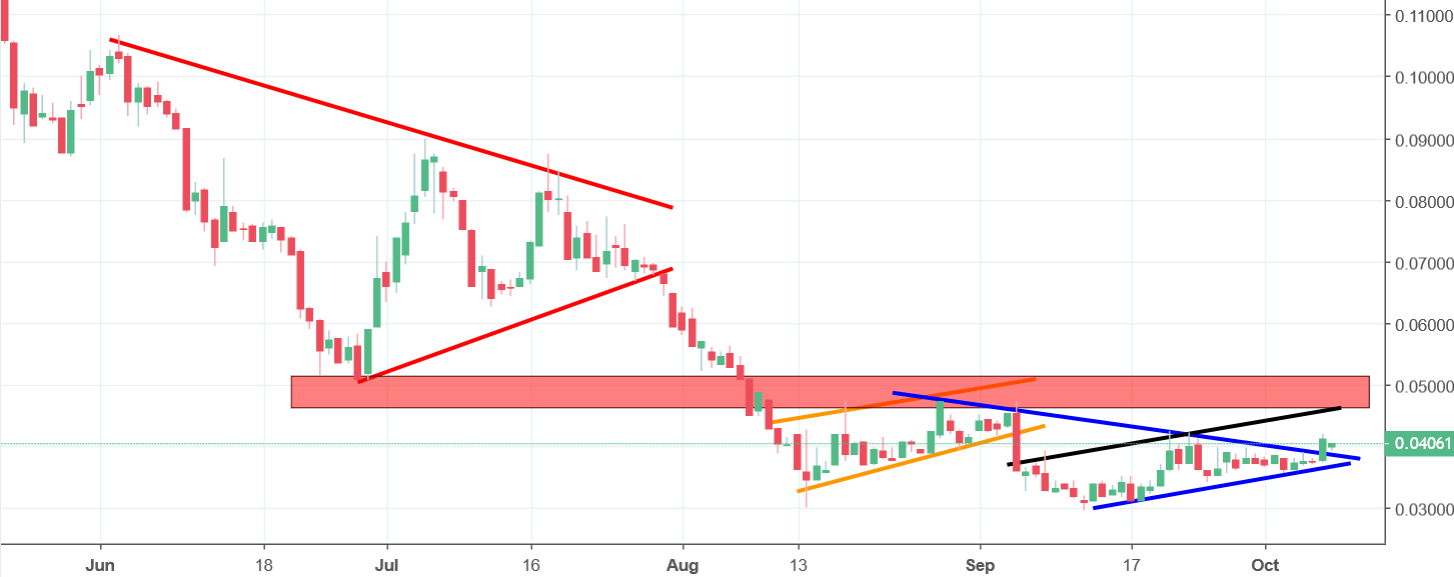
OK, maybe there is one little detail. The upswing from yesterday, may be breaking the upper line of the symmetric triangle pattern (blue lines), which may be perceived as a bullish sign. May but does not have to as in the same time, the price is in the flag pattern (lower blue, upper black). That would make more sense, as the previous pattern was also a flag (orange) and also resulted with the breakout of the lower line.
The ultimate resistance here is the 0.05 USD (red). I think that this is the place, which will sort everything out. A bounce will give us a sell signal and a breakout will be an invitation to go long.


Comments (0 comment(s))