Steem Analysis – Current flag is promoting a further rise

Last guest on Wednesday is Steem. We wrote about this coin on the 12th of June and that analysis was pretty nice but do not believe us just like that, check yourself:
“Now, we are on the 1.58 USD and to get here, we broke an important horizontal support on the 1.75 USD (orange), which was with us since July 2017. Currently, the target is on another horizontal area around the 1.35 USD (red) and the movement towards this line seems imminent. “
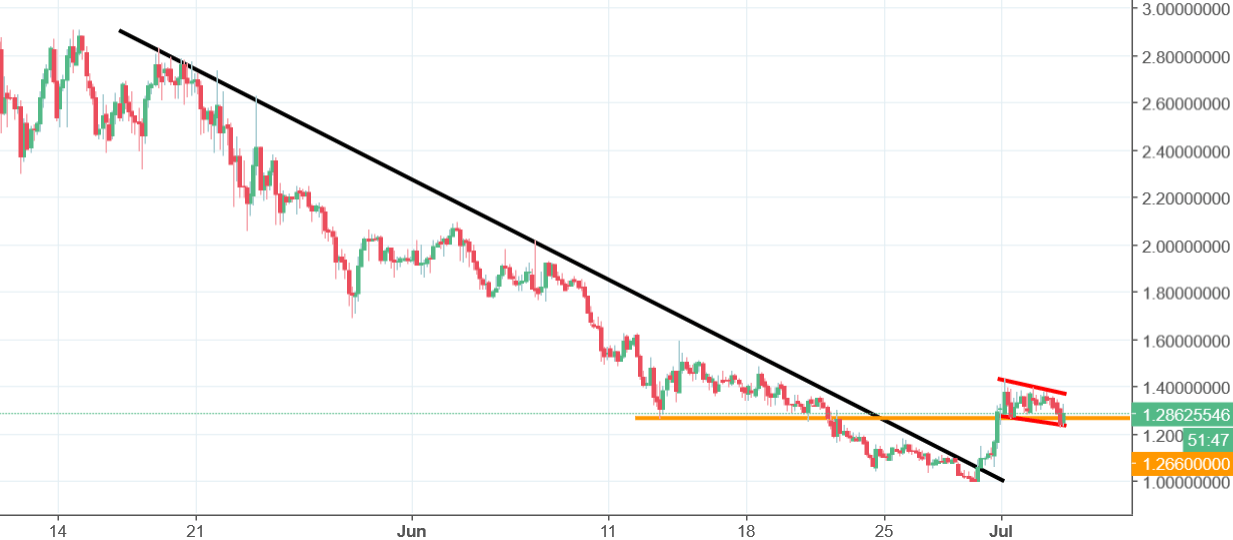
1.35 was reached very easy. The price declined even further, reaching the psychological, round barrier on the 1 USD. This is where the drop stopped and the buyers started a reversal. Technically, the upswing started quite innocent: the price broke the mid-term down trendline (black). After that, the rise was backed up by the flag (red lines) and the defence of the 1.26 (orange) support, which is happening right now.
If you need more confirmation, you can wait for the breakout of the upper red line. Once we will receive that, we will be able to claim full bullish victory, which can lead to a stronger positive movement in the nearest future.


Comments (0 comment(s))