Walton Analysis (WTC) – iH&S in play
The last analysis of the day, will be about the Walton. This coin was on our radar on the 9th of May, when the price was triggering a sell signal after breaking the support on the 15 USD. Back in that day we said:
“As long as we stay below the blue line (15USD), the sentiment is negative. Comeback above the blue area will deny the sell signal but the chances for that are now limited. „
On the 24th of May, the price was as low as on the 10 USD, which means over 30% drop in value. That was a good call, right? From that point, the Walton reversed. WTC created an inverse head and shoulders formation (similar to SiaCoin, already analysed by us today). 2 days ago, the price broke the neckline, which triggered us a short-term buy signal. It seems, that we will test the 13.9 USD resistance (green) soon.
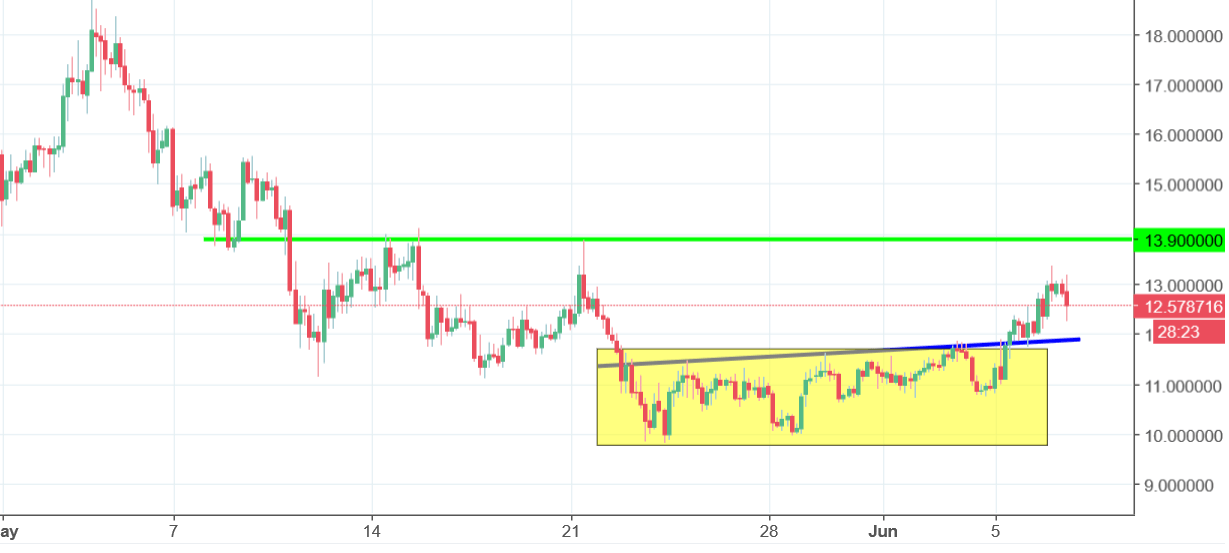
Short-term sentiment stays positive, even despite the fact that the WTC is going down heavily today. As long as we stay above the neckline (blue), we are still good here and we should see a further rise. Price coming below the neckline will mean a sell signal but chances for that are now a bit smaller.


Comments (0 comment(s))