Wan Analysis – Nice bullish setup
Last analysis on Tuesday will be about the Wanchain and on this coin, we also do have a positive technical setup and a chance for the mid-term up trend. This is also the first time that we are writing about this coin but definitely not the last one as the technical situation here is very interesting.
Since the beginning of May, WAN was in a deep downtrend, which started with the head and shoulders formation. The price broke the neckline (black) and started to make new lower lows and highs. During the decline, the price created two trend continuation patterns: wedge and a pennant (blue lines). Both of them, resulted with the breakout of the lower line.
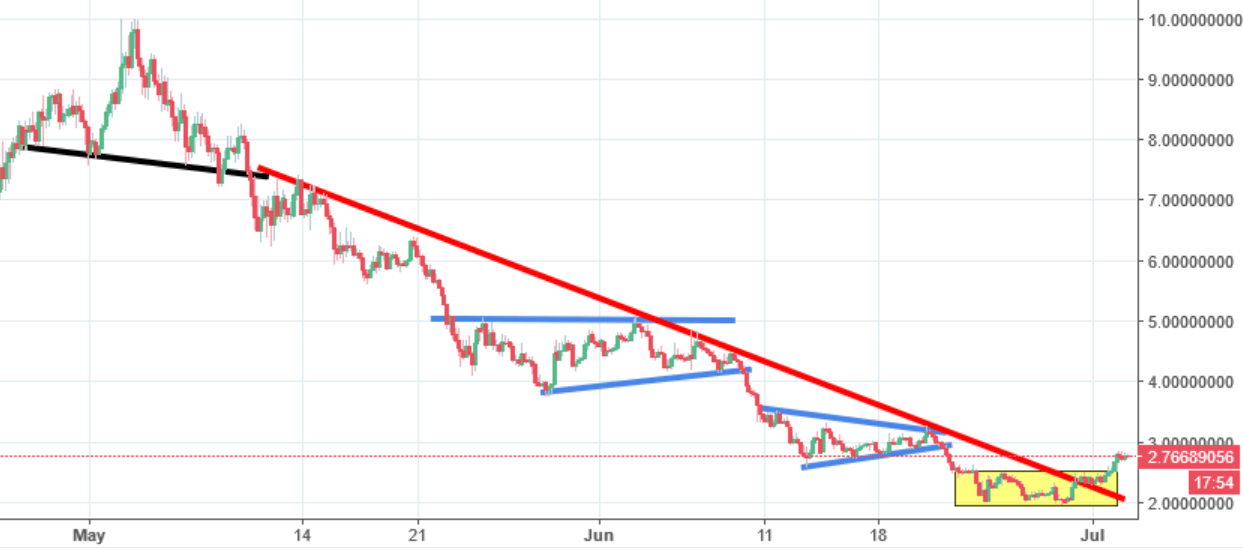
Most recently, the price formed a tight range (rectangle, yellow), which finished with the breakout of its upper line. Together with the breakout of the down trendline (red), that is a strong buy signal. As for now, we are up almost 3% but in my opinion this is not the end and in the next few days, we should climb vastly higher.


Comments (0 comment(s))