AUDCAD Analysis – Long-term resistance

The last instrument today is the AUDCAD, which will be mentioned on our website for the first time. Our analysis will be based on the situation on the weekly chart, where the price reached a very important horizontal resistance and we do have a chance for a strong bearish reversal.
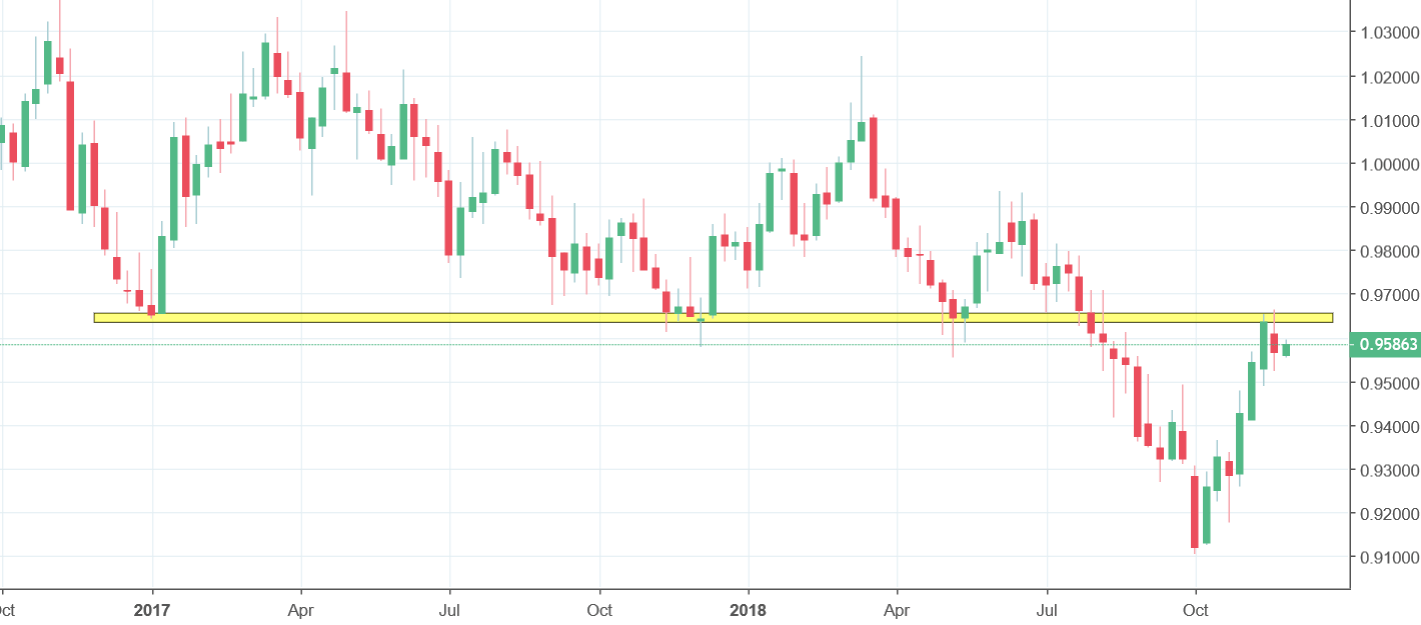
As you can see, AUDCAD is currently on the yellow resistance, which was a support in 2017 and 2018. This support was broken in the July and is currently being tested as a resistance. First test was positive for the sellers as the price bounced. The victory is not so strong as many sellers would expect. The price did not create any major reversal pattern. What we have here is an inside bar, which alone cannot be considered as a legitimate signal to go short. On the H4 chart we can see a triple top formation, which may be tempting but the thing is that today, traders are ignoring this pattern and the new week starts on the front foot.
In my opinion the best way to trade it is to sell when the price will beat the lows from the last week and to buy, when the price will break the yellow resistance. Somehow I think that the first scenario is more probable at the moment.


Comments (0 comment(s))