AUDUSD Analysis – Testing the neckline

On the 18th of September, we wrote about the AUDUSD, which was very close to the major buy signal as the pair was giving the last touch to the inverse head and shoulders pattern:
“The price is creating an inverse head and shoulders pattern (grey), which is just a first step towards the buy signal. For that, we need to see the breakout of the neckline, which in this case, is marked with a yellow colour. „
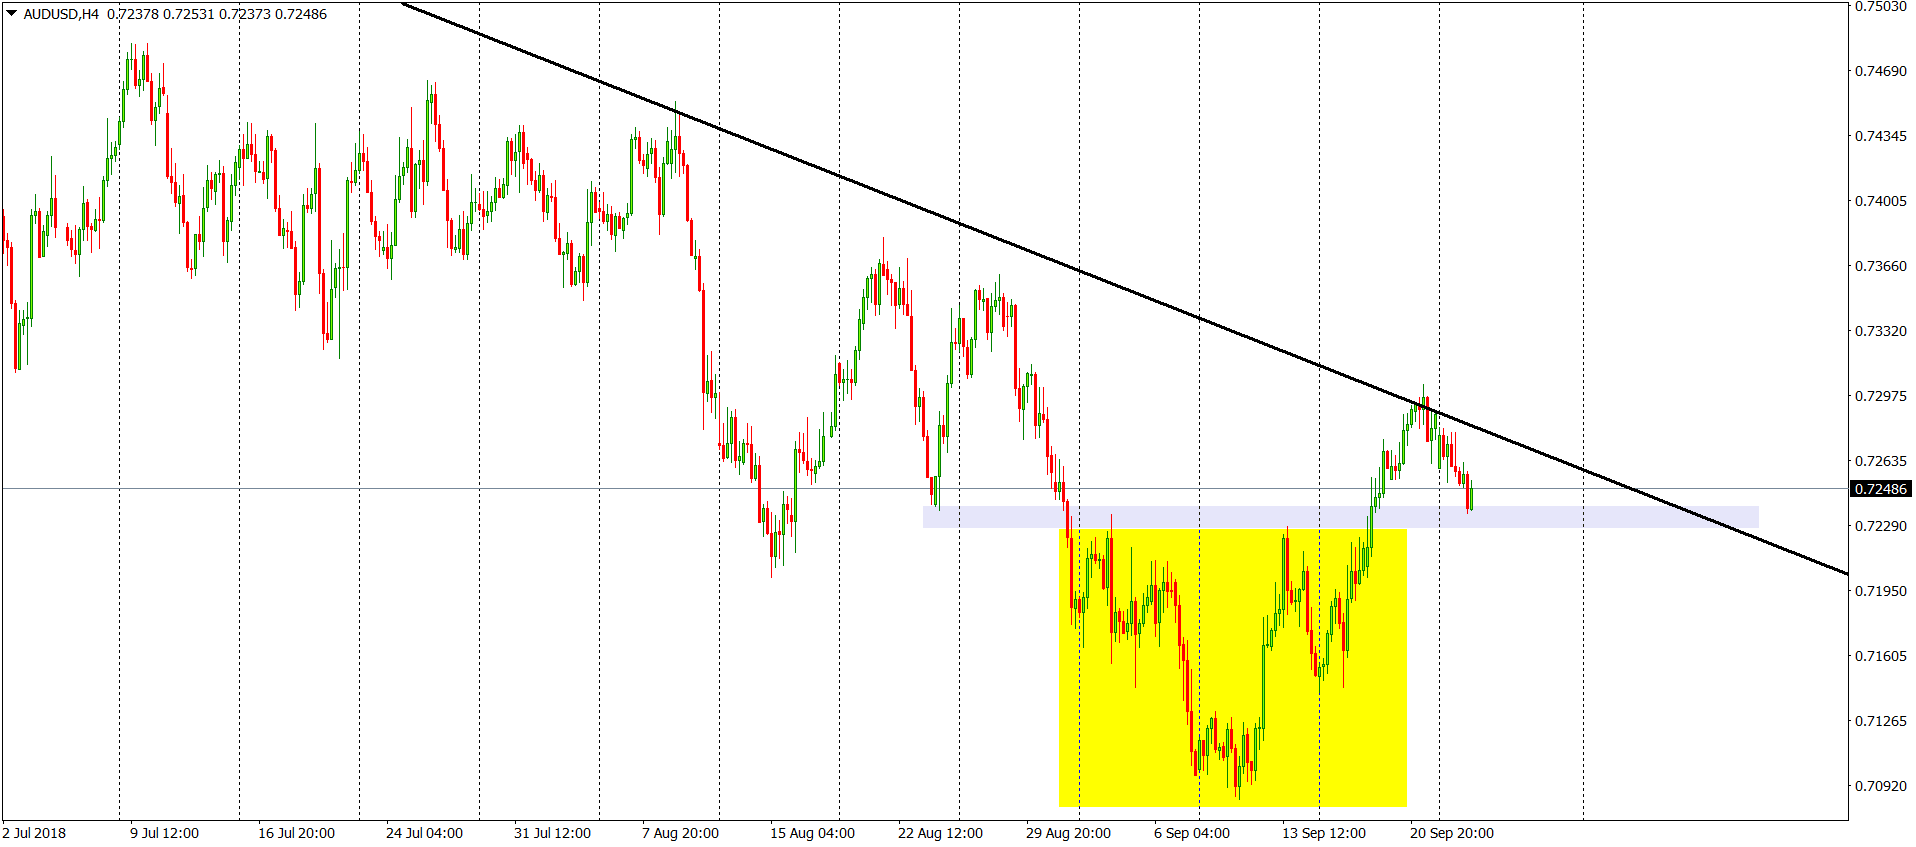
The buy signal, was created one day later, as the AUDUSD broke the neckline and made new monthly highs. AUDUSD went higher and on the 21st of September stopped on a super important dynamic resistance – long-term down trendline. This is the place where the bearish correction has started. Not that it was unexpected. It is pretty common that the broken neckline is later tested as a support. Which is happening right now, as we speak. As long as we stay above the grey line, the buy signal is on.


Comments (0 comment(s))