Dollar Index Analysis – H&S or a Triangle?

Dollar Index is currently in a crucial place for the mid-term situation on this instrument, so basically for the whole FX market.
Since the end of February, the price was forming a nice head and shoulder pattern. This is a reversal pattern, so gives higher chances to the sellers. In case of this formation, the only thing missing to a proper signal is the breakout of the neckline (purple area). For now, it seems like this breakout has been delayed and is not an option for the next few days.
Instead of the breakout of the neckline and a downswing, the price is trying to play an opposite scenario. Dollar bulls, instead of the H&S pattern, can see a symmetric triangle formation (red lines) and an attempt to break its upper line. Price closing above the upper red line should deny the H&S formation and can trigger us a nice buy signal.
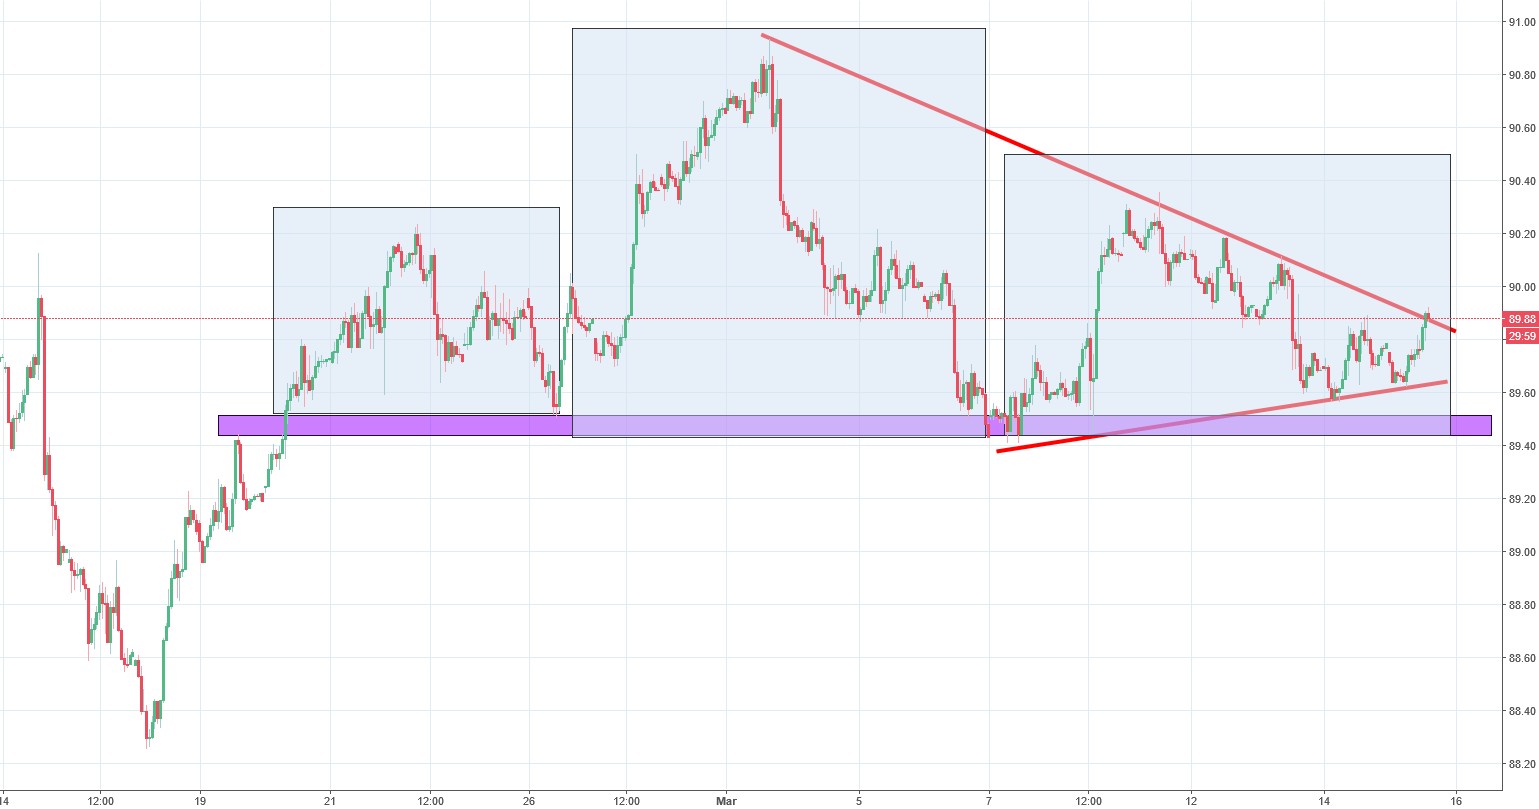
Currently it is a bit too early to tell but it is always better to know about the potential trade before it happens right? We are not here to explain what happened, we are here to tell you what you can expect in the future. To sum up, price closing above the red line is a buy signal and the price breaking the neckline is a sell signal. Simple is that.


Comments (0 comment(s))