EURCHF Analysis – Flag instead of the iH&S
Last instrument today and in the same time a proper lesson of the most important feature of a successful trader – patience. In this piece, I will write about the EURCHF, which we previously analysed on the 5th of November. Back in that day, the price was finishing the right shoulder of the iH&S and we were one step from a major buy signal:
“The buy signal from this pattern, will be triggered, when the price will break the blue neckline. In addition to that, we should break the 38,2% Fibo and the horizontal resistance marked with an orange colour. The price closing a day above those resistances will give us a proper buy signal. „
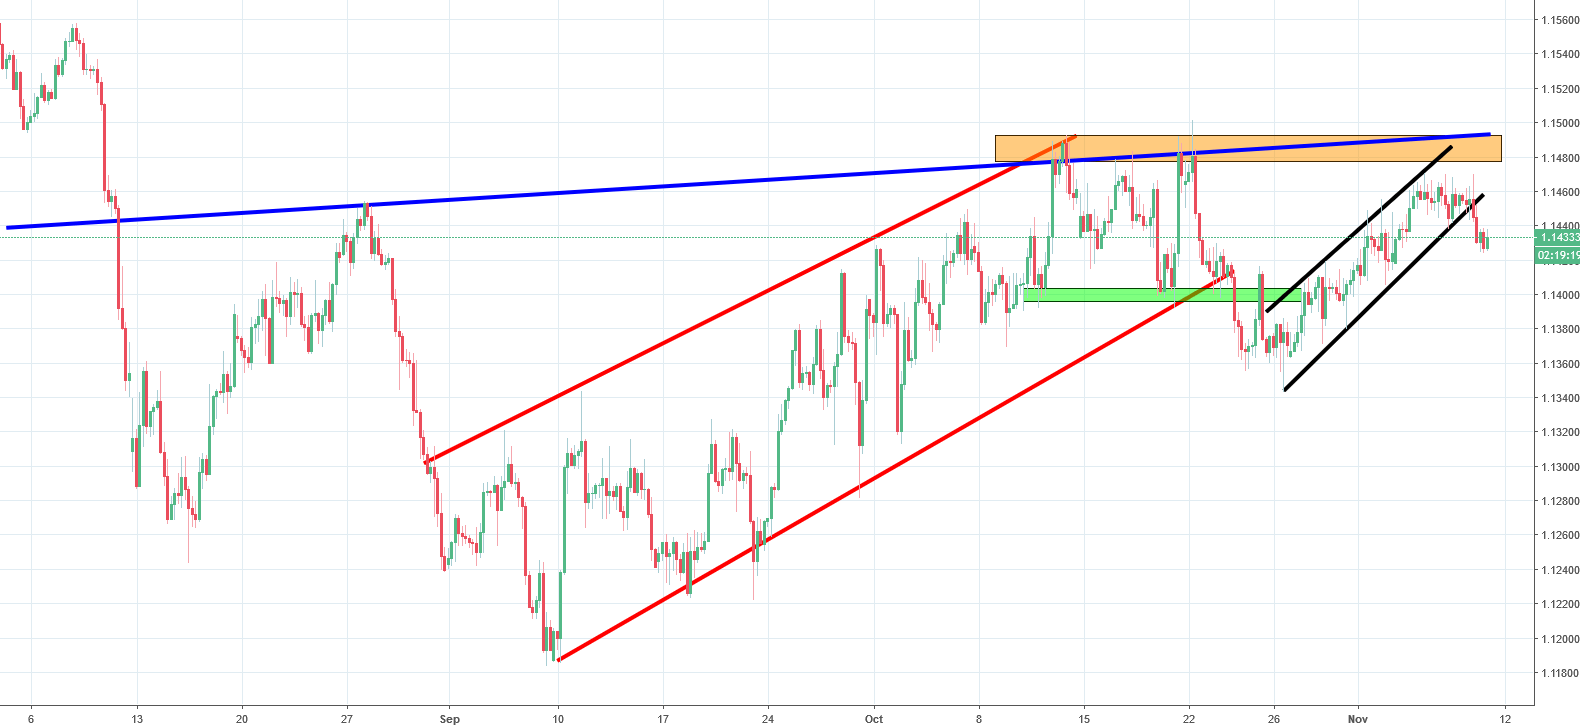
The price did not manage to break the neckline and went lower. This is why you have to wait for the breakout! Instead of the right shoulder, we finally got the flag (black lines). Flag ended with the breakout of its lower line, which is a legitimate signal to go short and that is our view for the next week here.


Comments (0 comment(s))