EURGBP Analysis – Sell signal got cancelled quite easily

We will finish the technical part with the analysis of the EURGBP, which we previously mentioned on Thursday, when the price was bouncing from a combination of two strong resistances. Believe me, from the price action point of view, that was an awesome sell setup. That is what we said back then:
“Flag ended on the horizontal resistance (yellow) and the dynamic down trendline (red) creating a double top formation. That is a super strong sell signal. With this kind of a price action we should definitely go lower in the next few weeks. Sell signal is on, as long as we stay below the yellow resistance. „
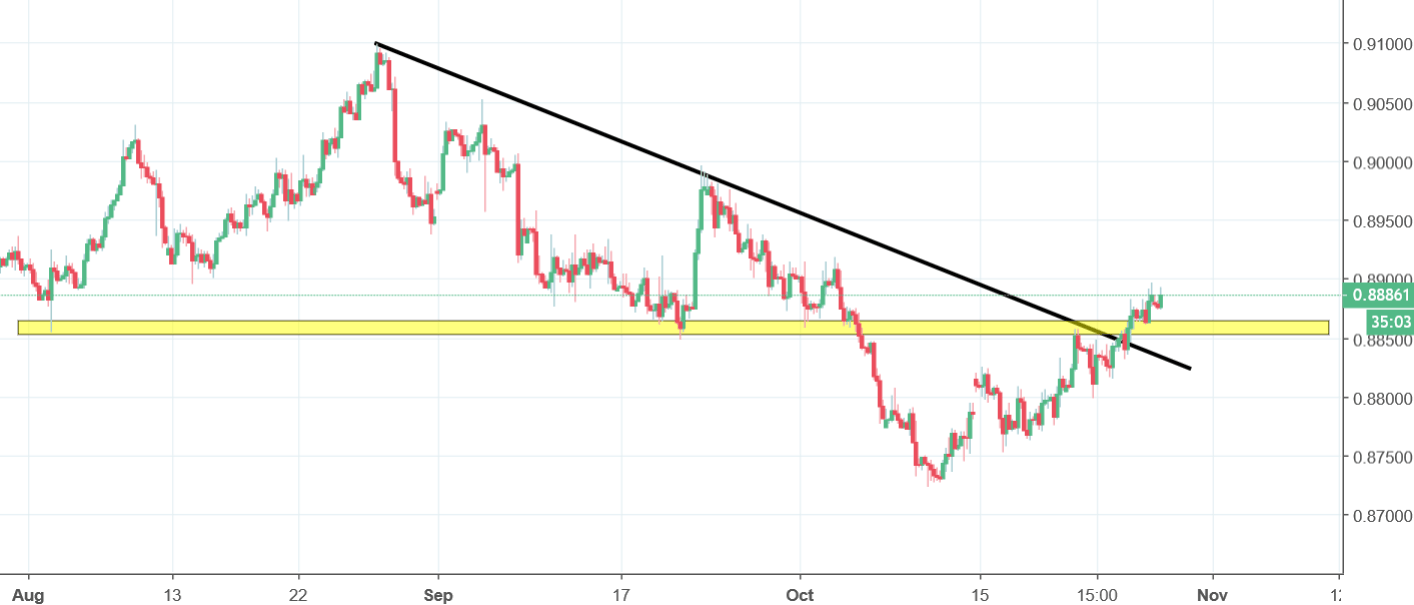
The bounce ended quickly and shortly, the price broke the resistance mentioned above. Luckily, we wrote exact place, where the negative approach looses its sense and where you should close your position. After the breakout, the yellow area was later used as a support, which confirms us a positive approach. Some may say that it is still good as the price is in a some kind of a correction pattern. Fair enough but major resistances got broken. We may come back to the negative approach only, when the price will break the yellow support and will close a day below. Other than that, there is no sell signal yet.


Comments (0 comment(s))