EURUSD Analysis – 1.13 is gone

Time for an update of the situation on the main instrument on the market – EURUSD. We previously talked about this instrument on the 6th of November and we were waiting for the upswing. Our prediction was based on the fact that the price was creating and inverse head and shoulders pattern (yellow) and was very close to the neckline:
“Previous support (blue) is now the closest resistance (and the neckline!). Price closing a day above that area will give us a proper buy signal. This bullish scenario will be additionally strengthened by the breakout of the red mid-term down trendline. „
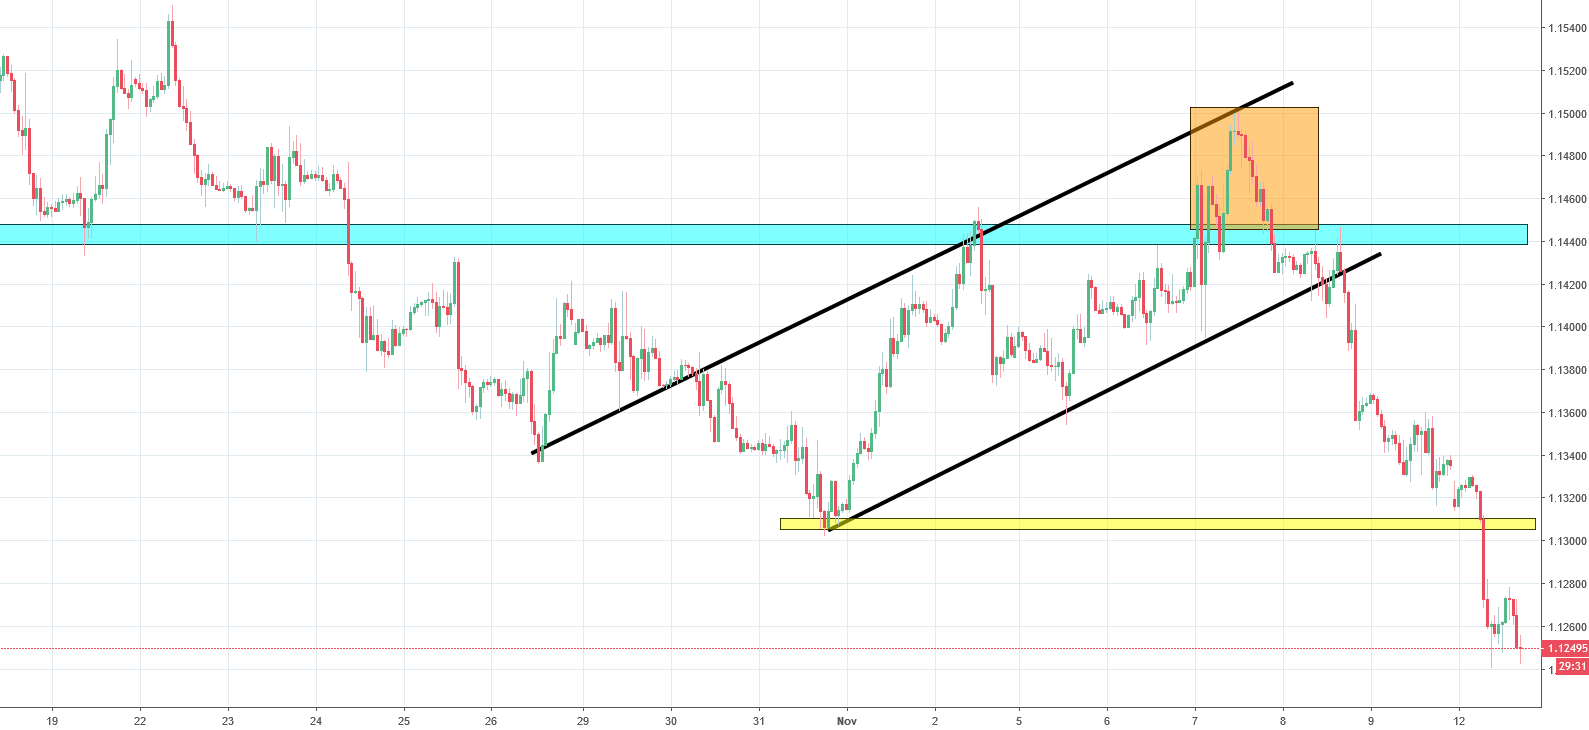
We did not have to wait long for that to happen. EURUSD broke the neckline day after that. In overall, that gave around 80 pips move. That was it though. That attack was a false breakout (orange) and the price went down. Instead of the iH&S we got a flag (black). The breakout of the lower line of the flag sorted out everything. We went to the full bear more. Today, price managed to break the 1.13 support (yellow). That is very negative and gives us a major long-term sell signal.


Comments (0 comment(s))