NZDCHF Analysis – Third triangle in a row

For the past few weeks, CHF was one of the best currencies in the world and was gaining significantly almost on every pair. It seems that the correction time has come and CHF buyers will start to take some profits.
We will use the NZDCHF as a nice example of that as the situation here is very technical and not only now but actually, for the past few weeks. In July, the price formed a nice symmetric triangle (green), which ended with a bearish breakout. On August, we had the same formation but a bit smaller (red). The outcome was the same though – drop. Most recently, the price created another, this time the smallest version of this pattern (blue) but surprisingly, the breakout was to the upside.
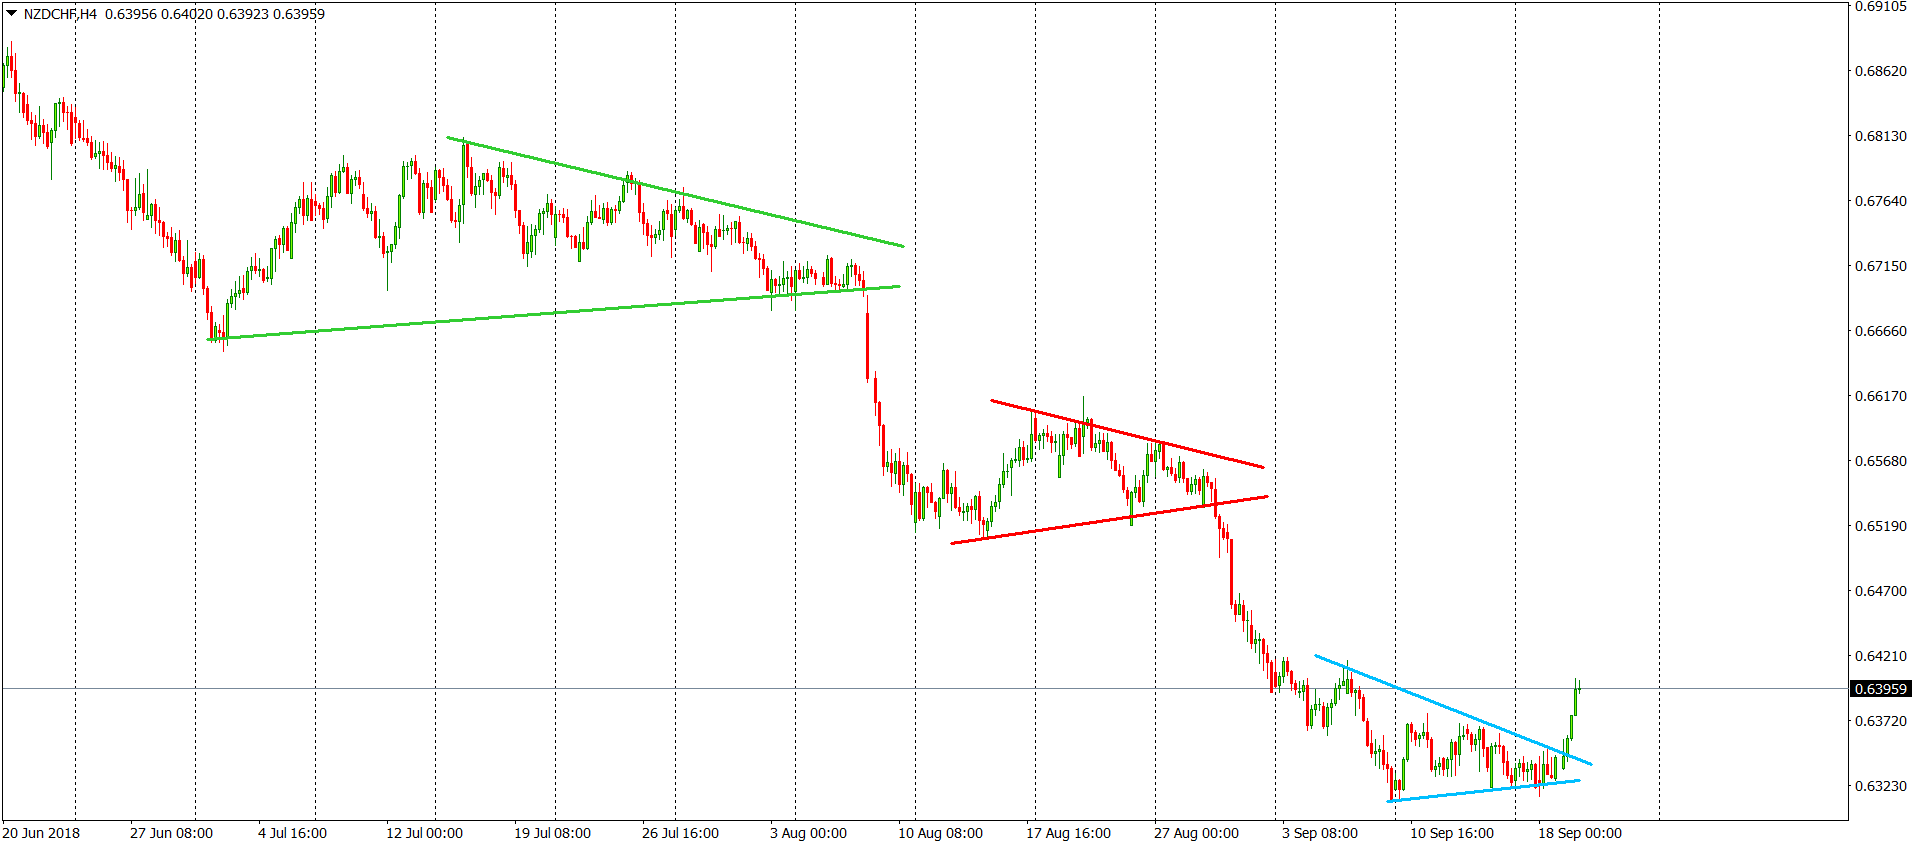
That bullish breakout brings us a buy signal here and a potential trend reversal. Correction is more or less certain but I think that buyers will try to use this momentum for something more than just a temporary rise.


Comments (0 comment(s))