NZDUSD Analysis – Broken down trendline!

Second instrument is the NZDUSD, which was previously mentioned here on the 25th of October. Back then, in our view, the situation was negative and we were expecting a strong drop, that is why we concluded our previous piece with the following sentence:
“With all this, the sentiment is totally negative and we should see a further slide. The sell signal will be cancelled, when the price will comeback above the right shoulder, which for now is less likely to happen”
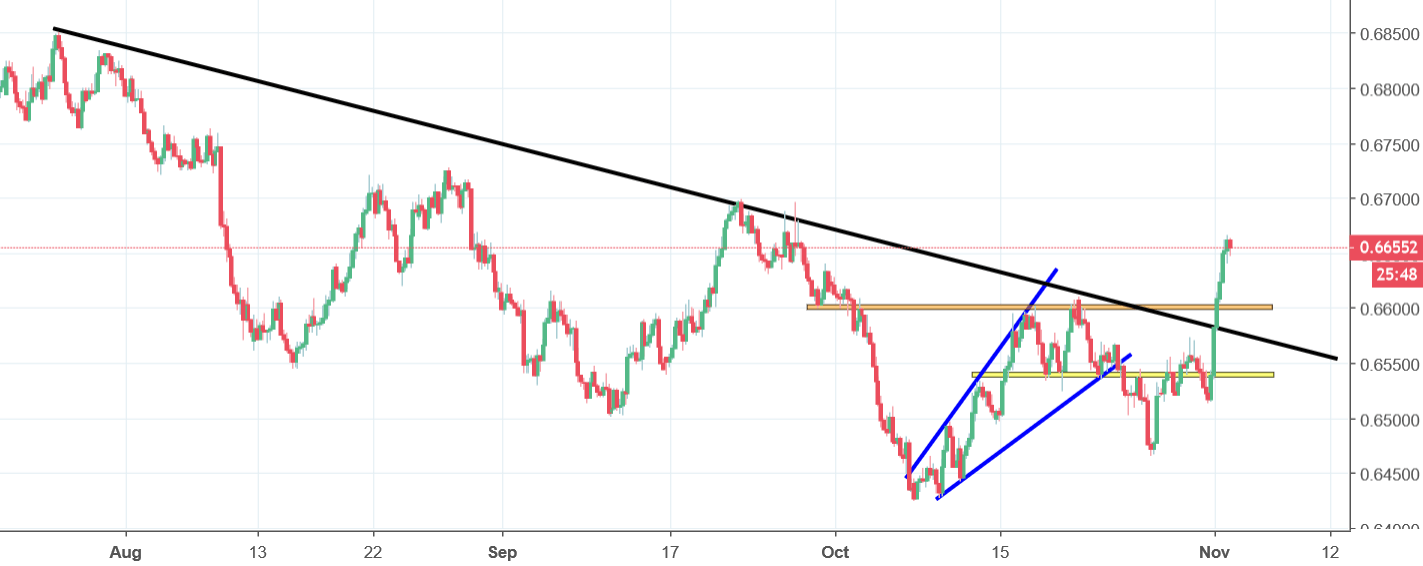
That was a good signal but only for the short-term day traders. The price went down almost 60 pips but that was it. From that point, the reversal started and currently, the negative approach is totally gone. The real game changer happened on Thursday. The price went up almost 150 pips and created a beautiful daily candlestick. That upswing allowed to break the black resistance, which was a long-term down trendline. That actually gives us a buy signal. Currently, we can expect a typical pull-back but most probably, it will only be a correction and the positive sentiment should remain intact.


Comments (0 comment(s))