USDCAD Analysis – False breakout

USDCAD may be getting ready for a major bearish breakout. Sentiment for the North American pair is pretty bad right now, even despite the fact that we are fighting on a major support.
From the fundamental point of view, we have a huge influence from the NAFTA talks here. From the technical point of view, recent drop is based almost entirely on the false breakout pattern (yellow rectangle). That was a false breakout from the long-term channel down formation and as they say: if the price does not want to go up, most probably it will go down. Most recently, USDCAD formed a bearish flag (black), which ended with the breakout of the lower line of this pattern and later, the orange dynamic up trendline.
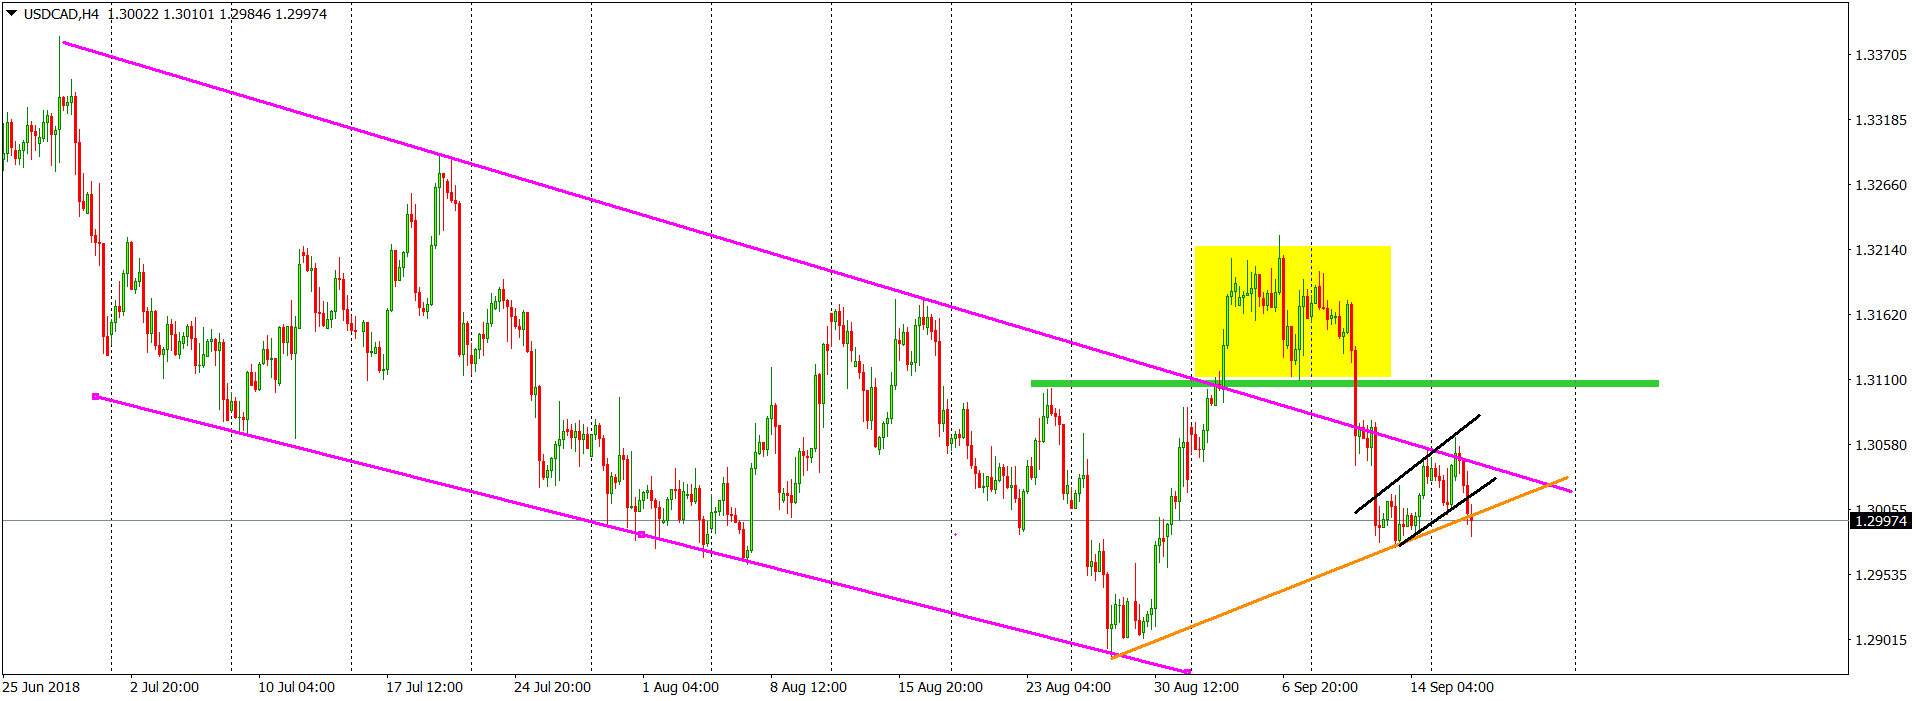
Price closing a day below the last one, will be a proper signal to go short, with the lows from the August being the closest target. Chances for that are very high. Sell signal will be denied, when the price will come back above the green horizontal resistance.


Comments (0 comment(s))