USDJPY Analysis – Still not a major sell signal

So yes, today we do have a real feast for the Dollar Traders – FOMC, In this case, let’s update you on the situation on the USDJPY, where since August, we are in a symmetric triangle pattern. Last time, we mentioned the USDJPY on the 7th of December and back in that day, we were bullish. Our views was based on the fact, that the price was bouncing from a dynamic support:
„Candle from yesterday has a long tail, which may indicate a willingness for a bullish reversal. Today, the price is following this, so we can assume, that this upswing will be continued. The big picture now is that as long as we stay above the orange horizontal support, the sentiment remains positive. „
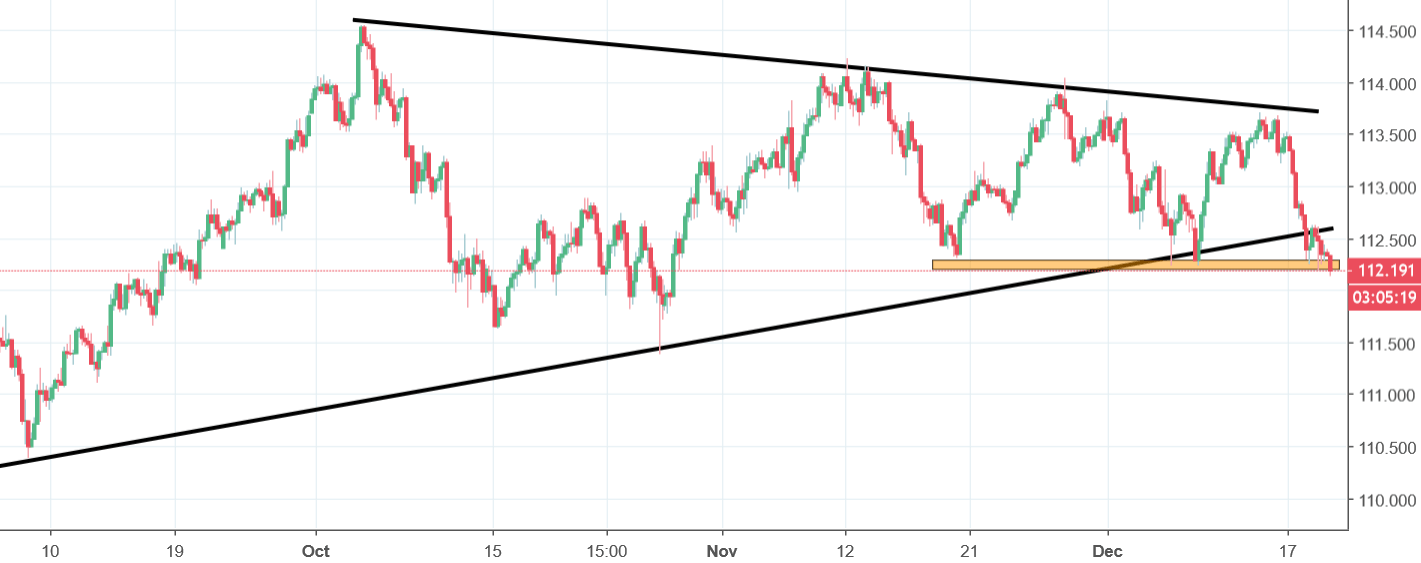
In the mid-term, that was a great call. The price was going higher till the 13th of December, giving potential buyers around 80 pips. This week started with the heavy drop of the USD, which drove us back to the point from the previous analysis. For some people, that drop actually brings a sell signal as it managed to break the lower line of the symmetric triangle pattern. For me, not so much as we stopped on a first important horizontal support (112.25). As long as we stay above, the bearish scenario is not complete. The price closing a day below that line will be a proper sell signal. Final answer we should get pretty soon.


Comments (0 comment(s))