USDJPY Analysis – Bounce from the up trendline
Last instrument in the technical part will be the USDJPY, where on Monday we saw a great selling opportunity. Back in that day, the price was around the 113.30 and we had a proper sell signal. Now, we are much lower than this but first let me show you, how we concluded the previous piece:
“This is a negative formation, which is additionally already active as the price broke the neckline (red). With this kind of the price movement, we should soon witness a further drop aiming the lower line of the symmetric triangle…again. My vote goes for the short side of the market here. „
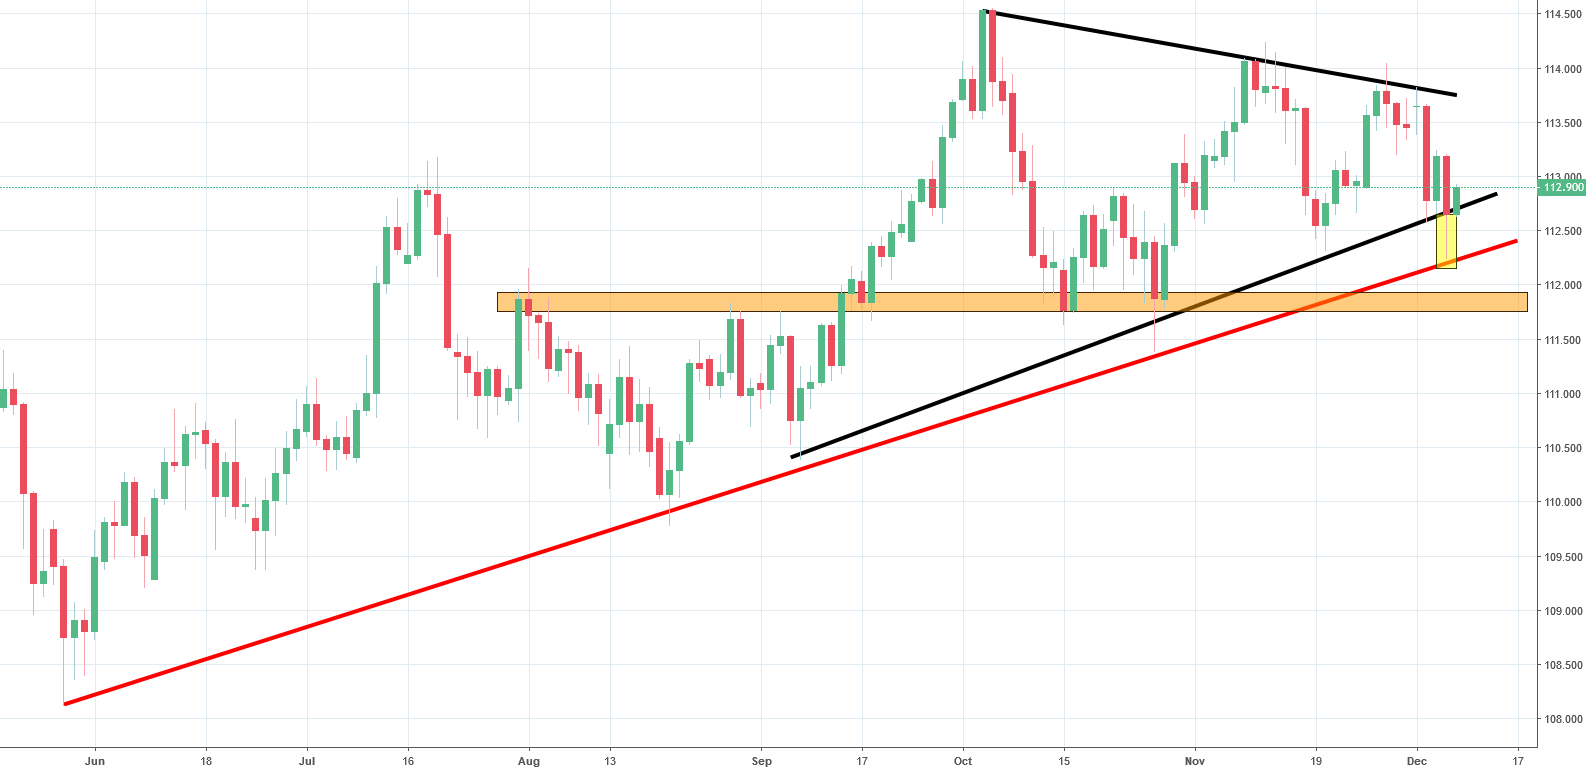
We were right, the price declined sharply. Yesterday, we were even more than 100 pips lower. Many traders thought that we broke out of the symmetric triangle pattern (black) to the downside. What they forgot was the long-term up trendline (red), which was used as a support. Candle from yesterday has a long tail, which may indicate a willingness for a bullish reversal. Today, the price is following this, so we can assume, that this upswing will be continued. The big picture now is that as long as we stay above the orange horizontal support, the sentiment remains positive.


Comments (0 comment(s))