USDJPY – H&S is showing the way

Now, let’s deal with the instrument, which was analyzed here on the last day of October – USDJPY. Back then, we were positive and we anticipated a further rise. That was a very good analysis, in the mid-term. Before we will tell you what happened and what can happen, we need to look at the previous piece first:
“After this, we got a typical market movement so a sharp rise breaking all the local resistances. The sentiment is back to the positive one and we do have a legitimate buy signal. USD is back! „
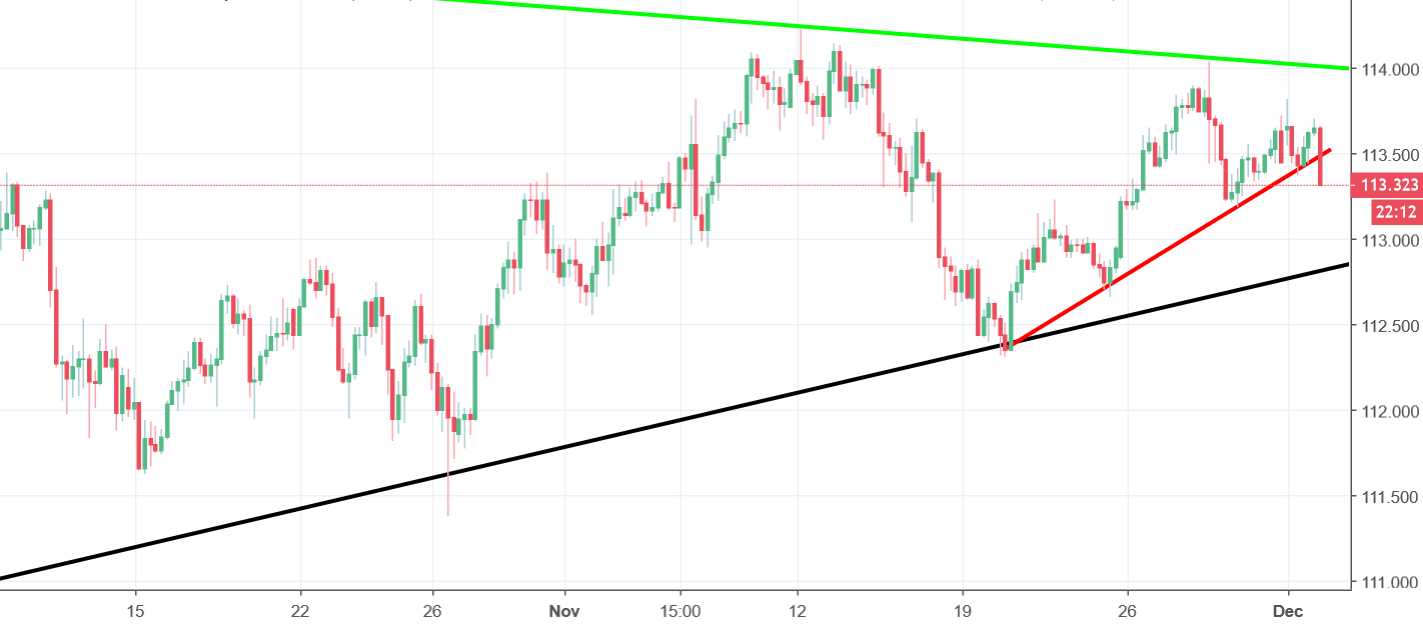
Yes, after those words were written, the price indeed went higher – slightly over 100 pips in less than 2 weeks. I’m not here to judge but this kind of profit is always welcomed. After this, we bounced from the upper line of the triangle, went to the lower one, bounced and went to the upper line again. Another test of that line resulted in a same way – drop, which brings us to the current situation – Head and Shoulders patter. This is a negative formation, which is additionally already active as the price broke the neckline (red). With this kind of the price movement, we should soon witness a further drop aiming the lower line of the symmetric triangle…again. My vote goes for the short side of the market here.


Comments (0 comment(s))