USDJPY Analysis – Three broken resistances

What a day we had yesterday! So busy with the ECB, BoE and CPI from US. No data from Japan though and today we will focus on two pairs with the JPY. First one will be the USDJPY, where yesterday’s candle, bring us a legitimate buy signal.
Candle from Thursday, broke three important resistances at once. The first one was the upper line of the symmetric triangle pattern (black). The second one was the neckline of the iH&S formation (blue). The third one, was the mid-term horizontal resistance on the 111.8 (pink). All that is very positive and brings us a buy signal on this instrument.
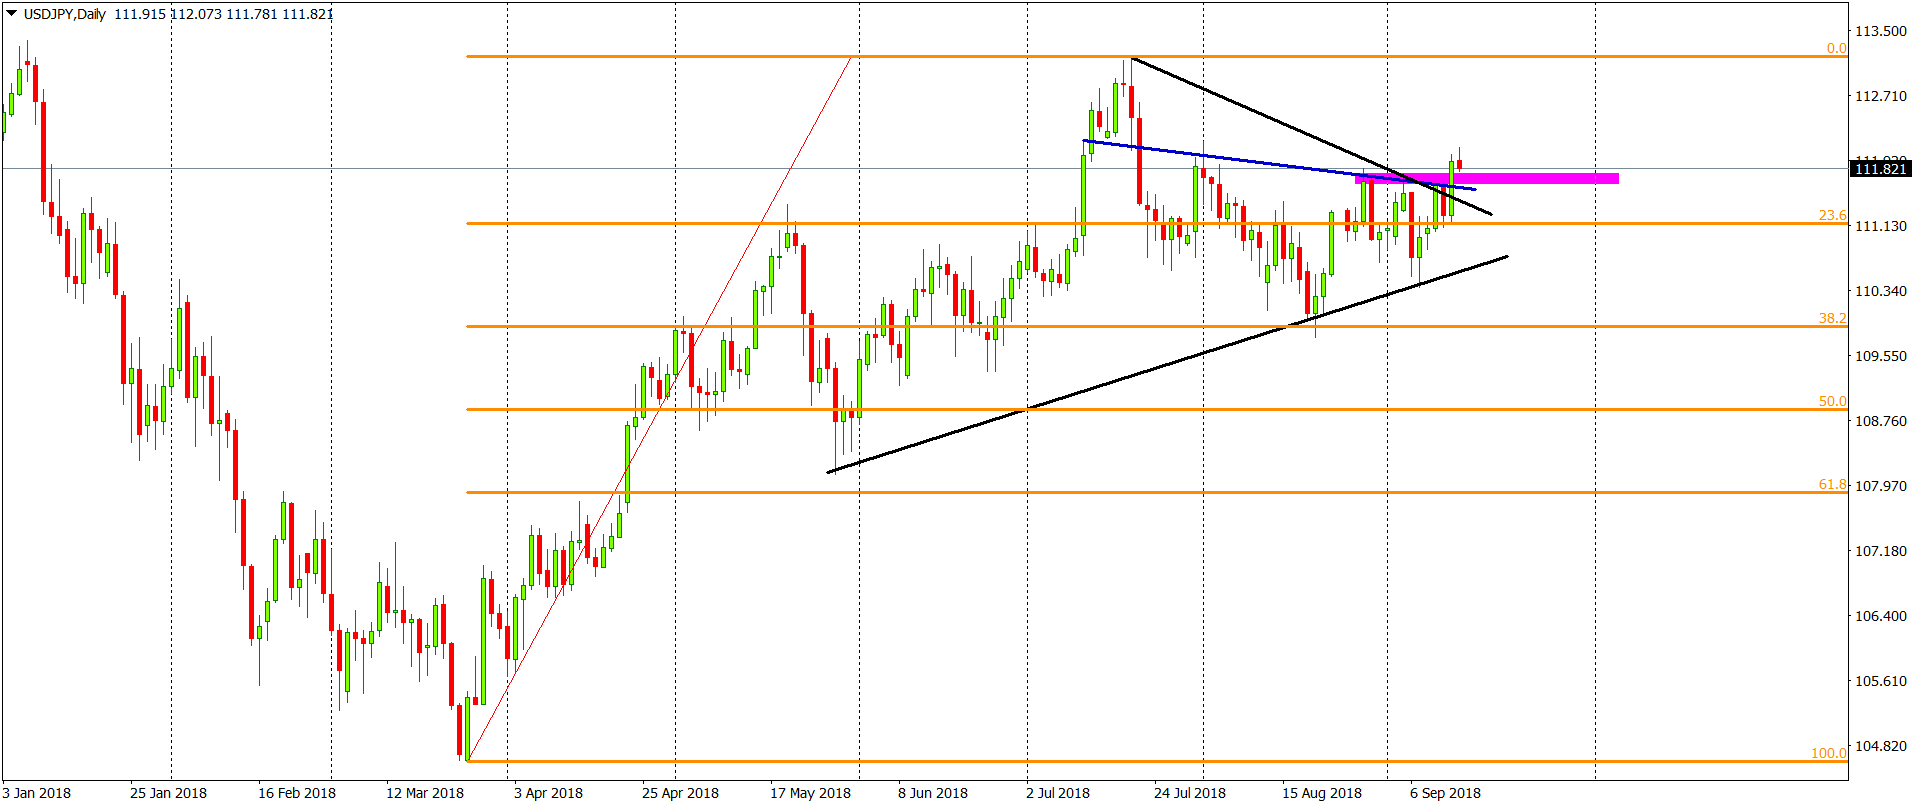
The bearish scenario, will be triggered, when the price will come back below the 23,6% Fibonacci along with the lows from yesterday. It seems like a good indicator for the bullish strength. First target is on the highs from July and we have high chances of getting there.


Comments (0 comment(s))