XAGUSD Technical Analysis
Silver prices edged higher on Tuesday, this was the first time in the last 6 trading days in which the XAUUSD had been bullish. Most of the pair’s upward momentum was the result of the uncertain outlook for the US currency, which has been mostly under pressure since the start of the week. In spite of the positive CPI data released for the month of September in the US (where the index climbed higher to 0.3% MoM and 1.5% YoY), the core CPI, however, failed to meet analysts’ forecasts, slipping lower from 0.3% MoM to 0.1% MoM.
The US data on inflation was received with some level of confusion. Some analysts saw them as a sign of balance in the US economy, which would, of course, have some positive effects on the Fed’s forecasts for a hike in the interest rates before the end of the year. Some other market participants who were rather skeptic and more focused on the weakness of the index which excludes energy and food drew only a negative outlook from the release.
Support/Resistance Levels
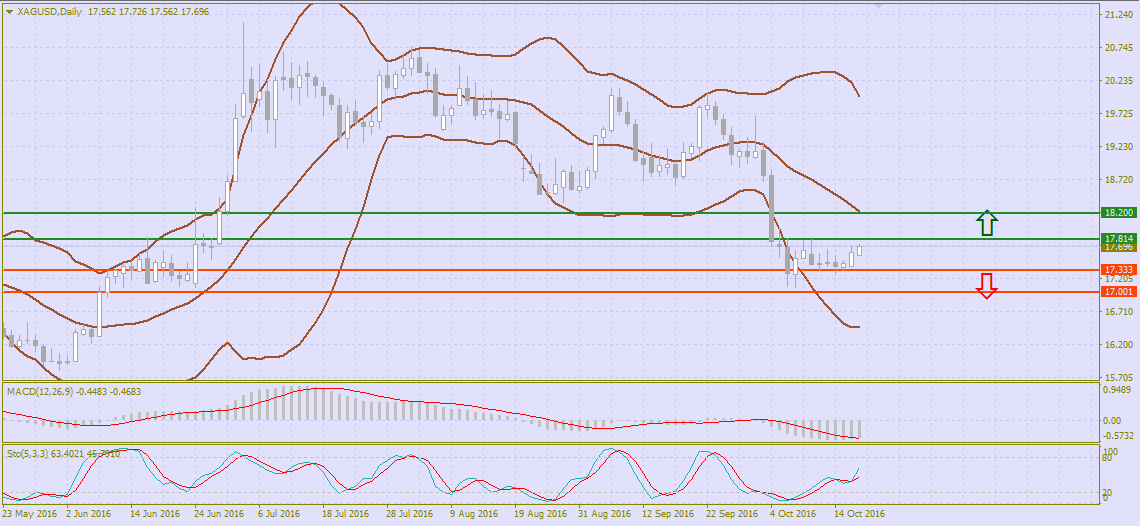
Resistance levels: 17.70 (maximum of October 18), 17.84 (mark of October 5), 18.00, 18.18, 18.47, 18.65, 18.77 (level of October 4), 19.00.
Support levels: 17.50, 17.29 (minimum of October 14), 17.14, 17.00 (mark of June 9).
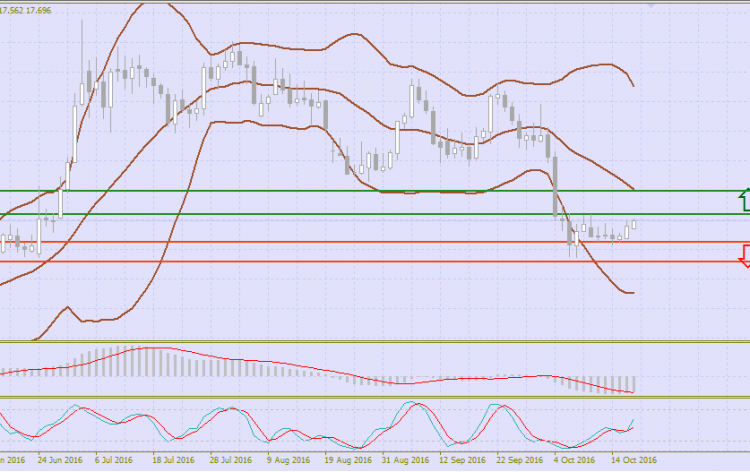
The Bollinger Bands indicator is heading down on the daily chart, with its price range wider, this shows another correction in the short term. It would be a good idea to stick to range trading strategies and watch the price testing average line of the indicator. The MACD indicator is changing into a weak buy signal (the histogram is above the signal line). It is recommended to keep current long positions and open new ones in the short and very short-term.
The Stochastic oscillator is reversing to the upside close to the border of the oversold area. The indicator is not contrary to the further development of a “bullish” trend, however, it points to a very limited capacity of a short-term “bull”.
Trading tips
A valid BUY signal would be a break above the 17.80-17.84 level, provided that evidence of technical indicators’ recommendations will remain “bullish”. Take-profit – 18.20 or 18.65. Stop-loss – 17.50. Implementation period of 2-3 days.
A valid SELL signal would be a strong rebound from the current price levels below the 17.3 level. The aim of the SELL trade, in this case,xa will be around in the area 17.00. And the Stop-loss is should not be set higher than 18.00. Implementation period of 2-3 days.


Comments (0 comment(s))