Crude Oil down 3%, testing 2018 lows. XTI/USD Technical Analysis

Oil prices dropped to a 2018 low on Friday, despite oil producers considered decreasing production to stem a rising global surplus.
The US-led oil supply is growing faster than demand, and it prevents the accumulation of unused fuel, such as the one appeared in 2015, the OPEC is expected to hold off production after the meeting scheduled for December 6.
However, so far this is not enough to support the price. The cost of a barrel of oil has fallen by around 20 percent in November, for seven weeks in a row.
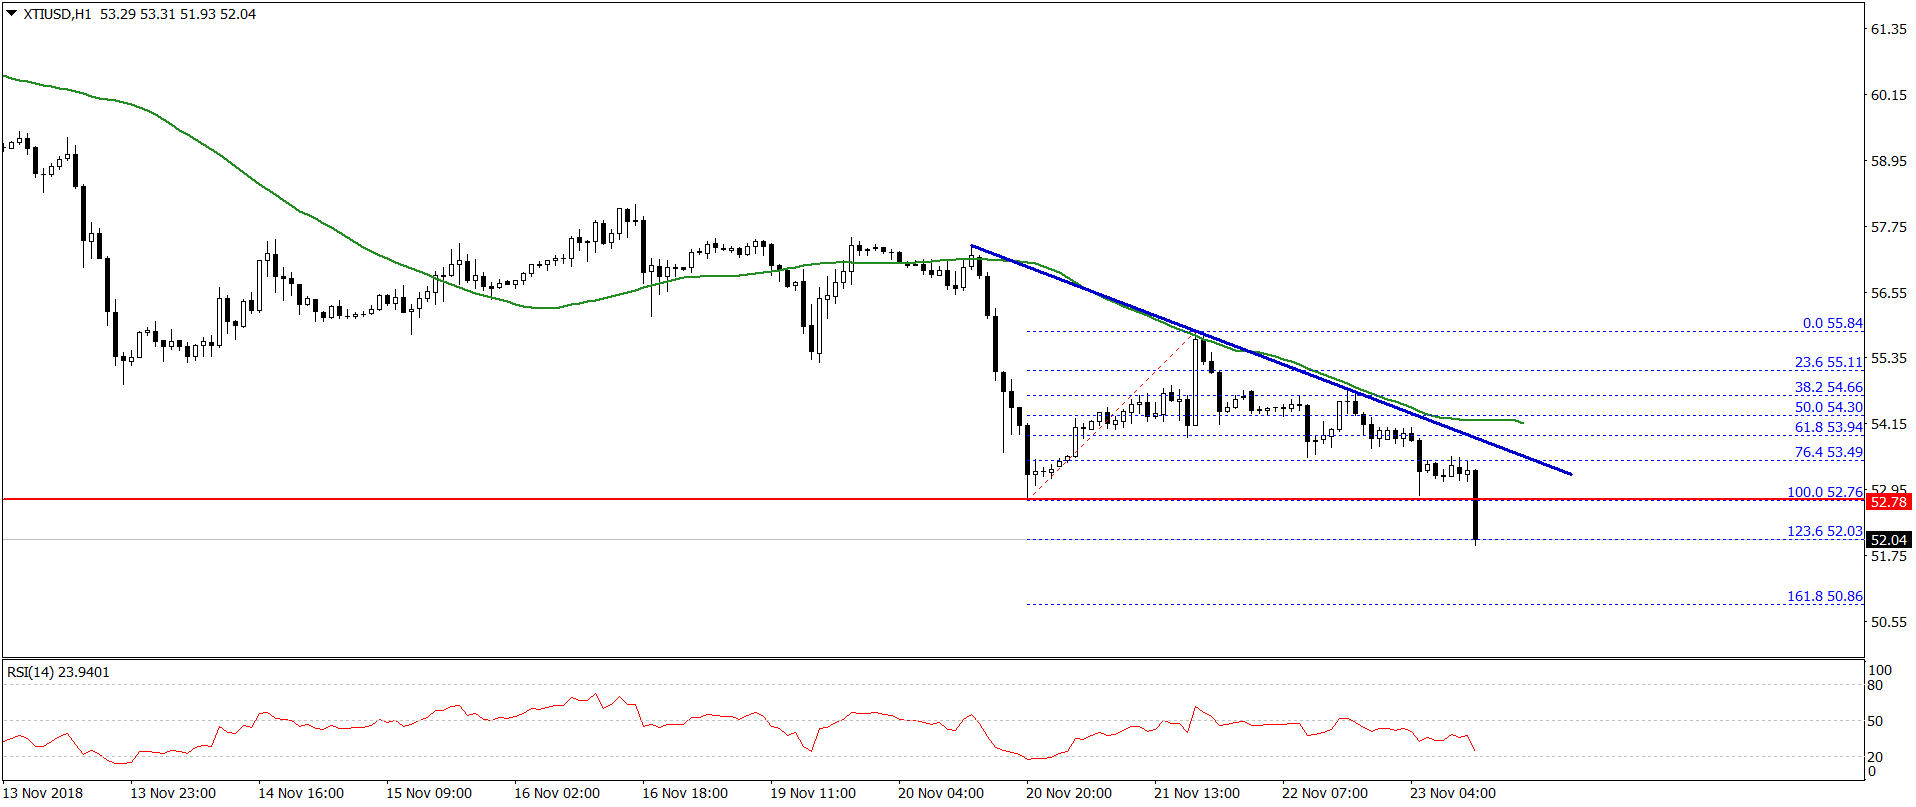
Crude oil price faced a solid resistance near the $55.80 and $56.00 resistance levels. As a result, there was a fresh decline and the price traded below the $53.00 support area.
Moreover, it seems like the price was rejected near the 50 hourly simple moving average and a crucial bearish trend line with resistance at $53.50 on the hourly chart.
At the moment, the price is trading well below the $52.75 support, which is a bearish sign. The next major support is at $50.86, which is the 1.618 Fib extension level of the last wave from the $52.76 low to $55.84 swing high.
Below $50.80, there could be a sharp decline towards the $50.00 level in the near term. On the upside, resistances are at $53.50 and $54.00.


Comments (0 comment(s))