DAX Analysis – Failed iH&S

Time for an update about the situation on DAX. For the last time, this German index was analysed here on the 15th of October. Back then, we were bearish and we saw a great chance for a further drop. It was all caused by the breakout of the neckline of a giant head and shoulders pattern:
“Last week, brought us a breakout of the neckline (pink area), which is a trigger to go short. As for the potential target, we do have a long-term up trendline (orange), which connect higher lows since the 2011.„
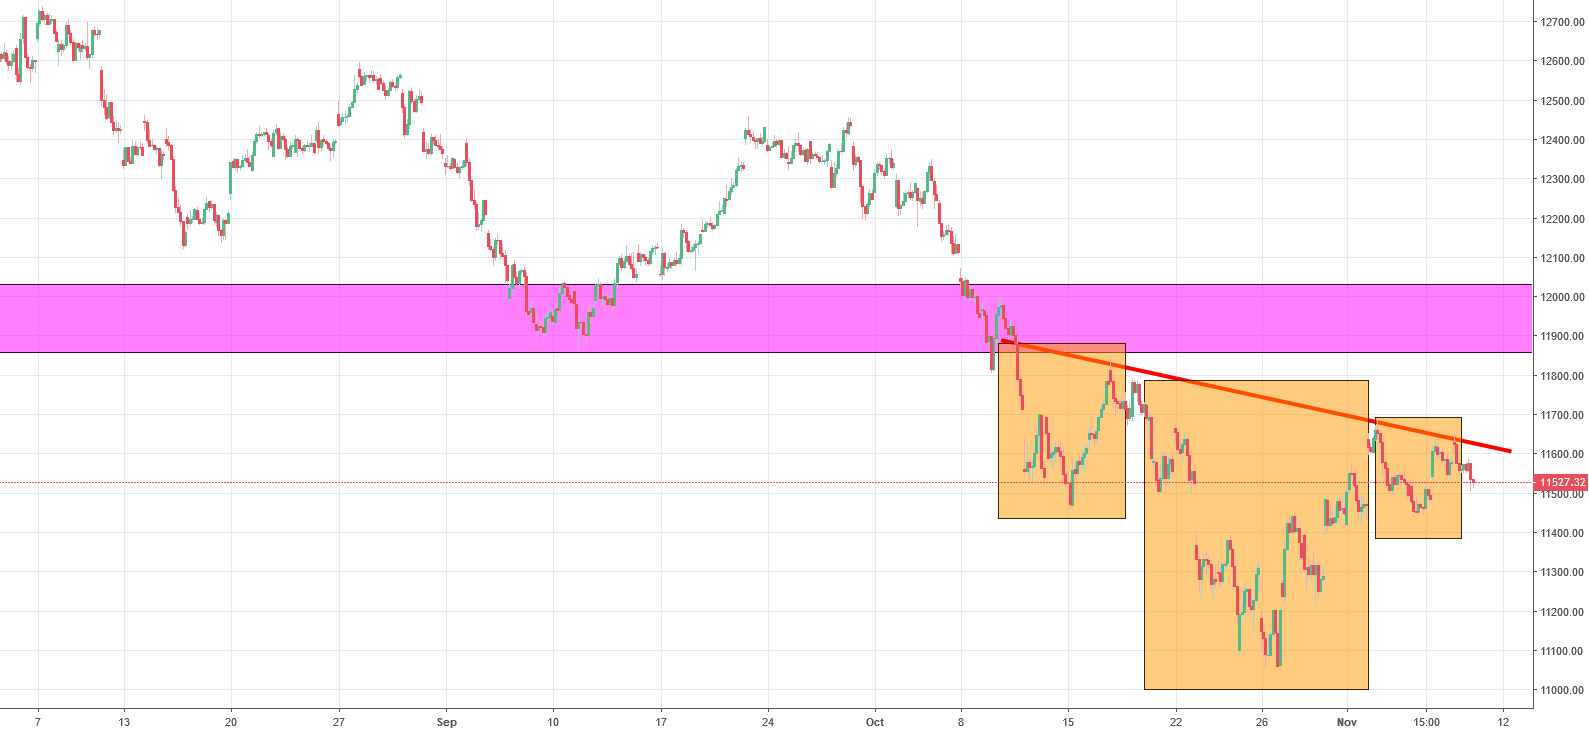
That was a great call. The price indeed went lower. We broke the up trendline mentioned above and checked on the support slightly above the 11000 points. End of the October brought us a small reversal, which allowed to create the inverse head and shoulders pattern (orange). That is a bullish formation. The only problem for the buyers is that we are still below the neckline (red). Failure to break the neckline can be a signal to do the opposite – Sell. In my opinion, as long as we are below the pink resistance (long-term neckline, mentioned in the first paragraph), the sentiment is negative and we should see a further slide.


Comments (0 comment(s))