Gold Analysis – False breakout?

Second instrument in the technical part is Gold, where we do have quite negative sign at the moment. Before we will move into this, we need to tell you what happen with our previous analysis, which was written on the 23rd of October. Back in that day, we were positive about the future price movements of this instrument:
“Actually, the breakout is happening now, as we speak, so the signal to go long is as fresh as the morning bread. The positive approach will be cancelled, when the price will comeback below the orange line, which as for now, is less likely to happen. „
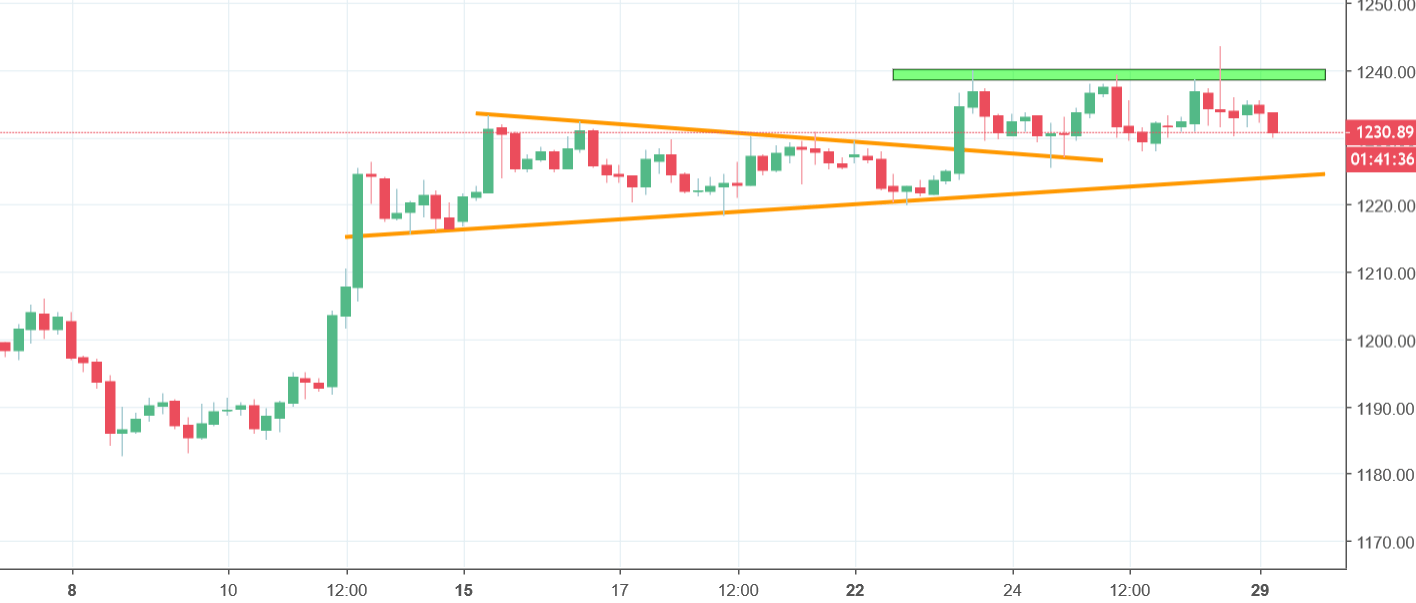
Yes, that was a good call as the price was aiming higher. The thing is that we soon met the ultimate resistance on the 1240 USD/oz (green). That area is in line with the 38,2% Fibonacci taken from the most recent downtrend. For sure that is and will be a strong resistance. Actually we saw that on Friday. The price tried to break that area but failed. That allowed to create a shooting stars candles on both: H4 and Daily charts. The fact that we have a false breakout is definitely not good and we can see that at the beginning of the European session. After Friday, chances for a bearish correction rose significantly. The proper sell signal, will be triggered, when the price will break the lower orange line (as we said a week ago), cause that will create a strong double top formation.


Comments (0 comment(s))