Gold Analysis – It does not look good

Tuesday starts for us with the analysis of Gold. The last time we mentioned this instrument was the 29th of October and back then, we saw a chance for a bearish movement. The price was on the 1230 USD/oz and was about to head south after the false breakout pattern:
“After Friday, chances for a bearish correction rose significantly. The proper sell signal, will be triggered, when the price will break the lower orange line (as we said a week ago), cause that will create a strong double top formation. „
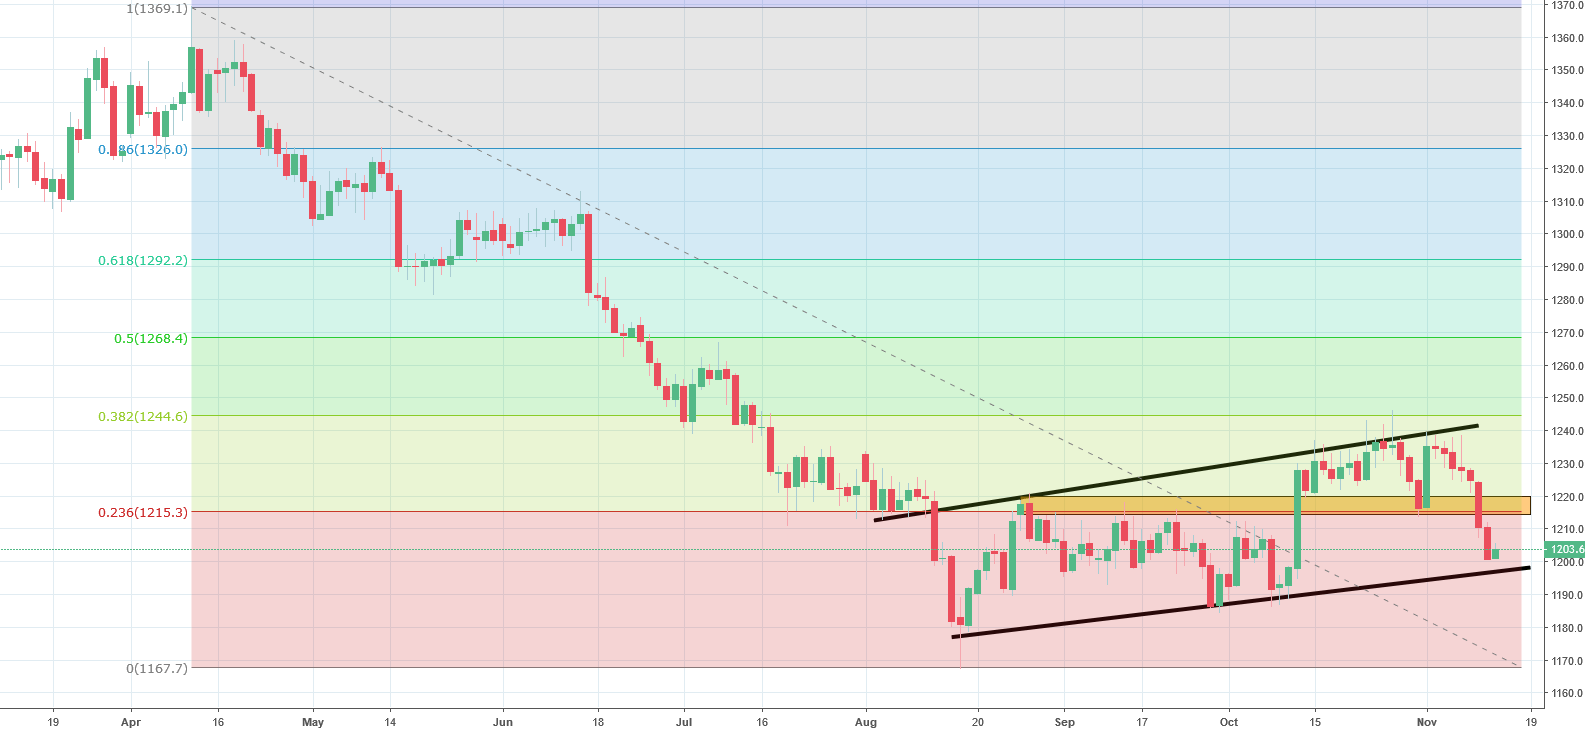
Currently, the ounce of Gold costs 1204 USD/oz, so You can see that our analysis was good. In opinion, the crucial for the whole downswing was the 9th of November, when the price broke the support on the 38,2% Fibonacci (orange area). In overall, the price is now creating a flag (black), which is a trend continuation pattern, so according to this, we should continue the downswing. Another negative factor here is the strength of the USD. The breakout of the lower line of the flag will give us a fresh sell signal and this scenario is currently more likely to happen.


Comments (0 comment(s))