Silver Analysis – Broken triangle

Time for an update on Silver, which was previously mentioned at the end of September. Back in that day, the price was breaking an important horizontal resistance but we said that it is not enough for a proper buy signal:
“Do not take that for granted though. Silver alone will go nowhere. We need a support from Gold,, which is still crawling. Technically, as long as we stay above the orange area, the buy signal is on. Comeback below will trigger the sell signal coming from the false breakout pattern. „
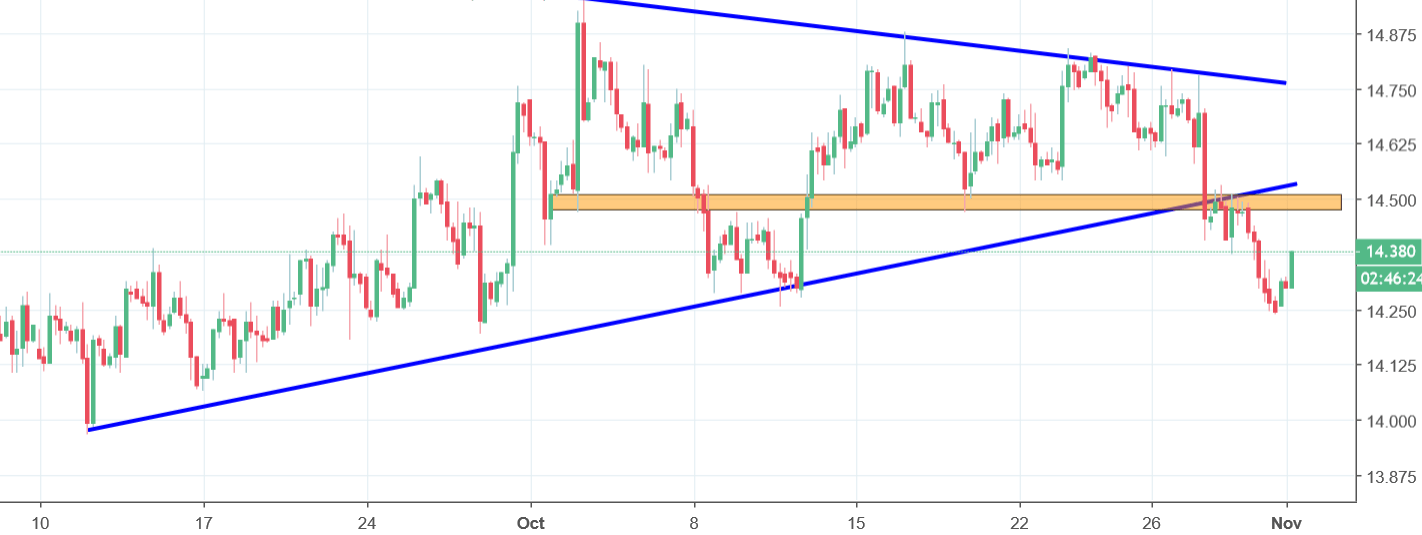
We were right. Since that, we did not experienced any major upswing or downswing, the price just stuck in the sideways trend and created a symmetric triangle pattern (blue). Pattern ended with a bearish breakout on the 29th of October, which brought us a proper sell signal. Quite surprisingly as Gold is still holding strong. Anyway, after the breakout, the price went lower and stopped on a new monthly lows. November starts with a small reversal, which in this situation is a normal pull-back.
Current scenario says that we should test the orange area as a closest resistance and after this we should continue the decline. Chances for that are quite high especially with a strong USD.


Comments (0 comment(s))