SP500 Analysis – Further slide
We owe you an update about the SP500, which was previously mentioned here on the 18th of December, so only 2 days ago. Back then, we reached our target, which in the same time, was a super important horizontal support. We warned you that it may look like a good occasion to buy but we said that you need more proofs to go long:
“Sellers attacked again and yesterday reached our long-awaited target – 2550 points (yellow). If you think that from this place, the Santa rally will start, think again. I think he should be here by now. Reaching this point may be rather a signal of capitulation than a great trading opportunity. „
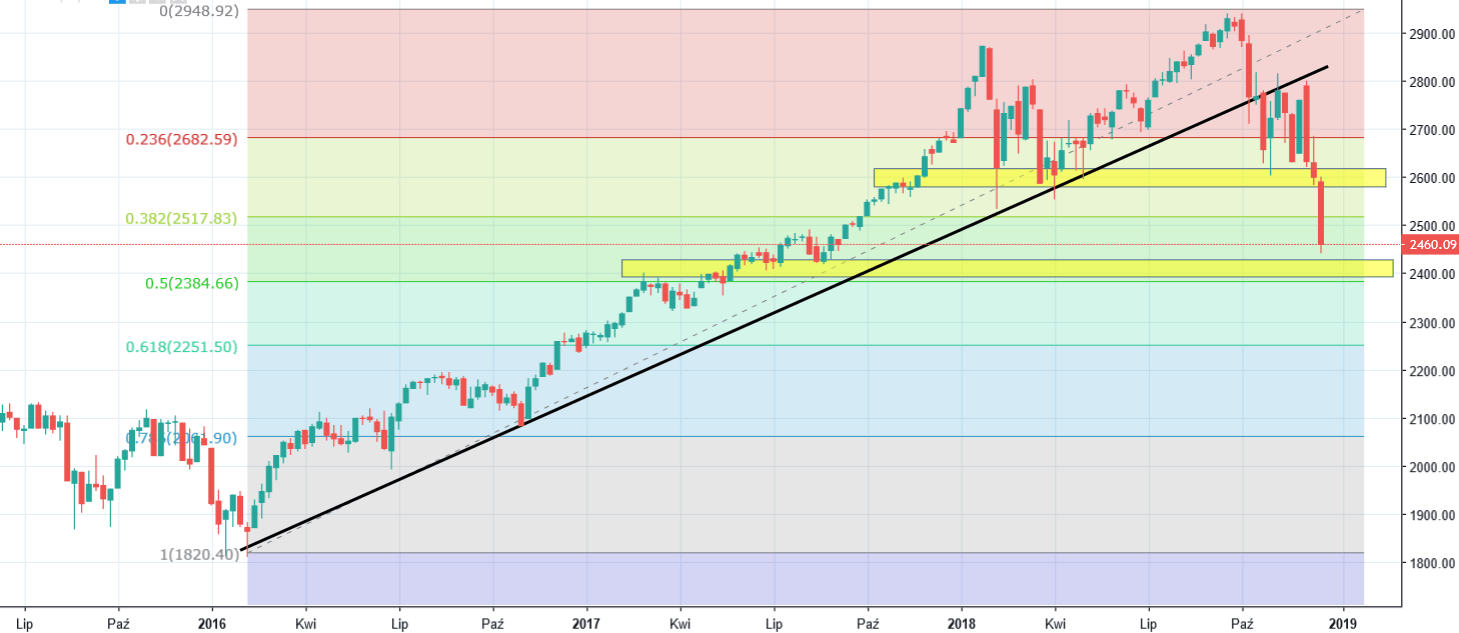
That was a great call! The price indeed did not stop there. Rising interest rates in US brought us a further negative pressure for the stocks and another bearish wave. Today, market continued this sentiment and managed to drop to the levels seen for the last time in the August 2017. Our another target is the lower yellow area around the psychological barrier of 2400 points. In the same time, this will be the 50% Fibonacci retracement of the uptrend present since the beginning of the 2016. On the paper, that looks pretty strong.


Comments (0 comment(s))